nullprogram.com/blog/2012/10/15/
There was some concern in the latest Debian newsletter about a
decrease in the bug reporting rate. It could be
signaling a decrease in momentum for Debian. Even worse,
this is actually part of a 6-year trend.
This has me a little concerned. Debian is an amazing project and it’s
responsible for so much of my productivity. It truly is the
universal operating system. No other (non-Debian-derivative)
distribution, or operating system in general, comes close, in my
opinion.
Fortunately this is only one of many statistics, and
observing bug reports is rather indirect. The other indicators say
things are healthy and growing. I suspect that the core packages that
most users have installed have matured over the years so that the bugs
are fewer and less severe. I also suspect that because Ubuntu has
attracted a lot of users, many bugs that would have been reported
against Debian are instead reported to Launchpad, without falling
through into Debian’s system.
I wanted to take a look at the data myself, so, using the
Debbugs SOAP interface, I grabbed all of the bug report
timestamps for all bugs from 1 to 690000 (where they exist). Here is
that data. The first column is bug number and the second is the unix
epoch timestamp.
Using GNU Octave I worked out a histogram and plot with 1-day bins. My
curve fit is a bit more optimistic than Don Armstrong’s. However, I
also have no idea what I’m doing,
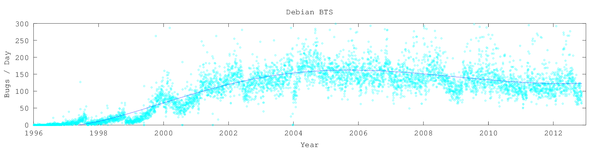
There was a peak 6 years ago, but things have recently plateaued —
except for very recently with the Wheezy freeze (June 2012), which is
expected. If you have any insight on this, please share.