The catch is that there’s no way to avoid using a bit of assembly. Neither
the clone
nor clone3
system calls have threading semantics compatible
with C, so you’ll need to paper over it with a bit of inline assembly per
architecture. This article will focus on x86-64, but the basic concept
should work on all architectures supported by Linux. The glibc clone(2)
wrapper fits a C-compatible interface on top of the raw system call,
but we won’t be using it here.
Before diving in, the complete, working demo: stack_head.c
On Linux, threads are spawned using the clone
system call with semantics
like the classic unix fork(2)
. One process goes in, two processes come
out in nearly the same state. For threads, those processes share almost
everything and differ only by two registers: the return value — zero in
the new thread — and stack pointer. Unlike typical thread spawning APIs,
the application does not supply an entry point. It only provides a stack
for the new thread. The simple form of the raw clone API looks something
like this:
long clone(long flags, void *stack);
Sounds kind of elegant, but it has an annoying problem: The new thread begins life in the middle of a function without any established stack frame. Its stack is a blank slate. It’s not ready to do anything except jump to a function prologue that will set up a stack frame. So besides the assembly for the system call itself, it also needs more assembly to get the thread into a C-compatible state. In other words, a generic system call wrapper cannot reliably spawn threads.
void brokenclone(void (*threadentry)(void *), void *arg)
{
// ...
long r = syscall(SYS_clone, flags, stack);
// DANGER: new thread may access non-existant stack frame here
if (!r) {
threadentry(arg);
}
}
For odd historical reasons, each architecture’s clone
has a slightly
different interface. The newer clone3
unifies these differences, but it
suffers from the same thread spawning issue above, so it’s not helpful
here.
I figured out a neat trick eight years ago which I continue to use
today. The parent and child threads are in nearly identical states when
the new thread starts, but the immediate goal is to diverge. As noted, one
difference is their stack pointers. To diverge their execution, we could
make their execution depend on the stack. An obvious choice is to push
different return pointers on their stacks, then let the ret
instruction
do the work.
Carefully preparing the new stack ahead of time is the key to everything,
and there’s a straightforward technique that I like call the stack_head
,
a structure placed at the high end of the new stack. Its first element
must be the entry point pointer, and this entry point will receive a
pointer to its own stack_head
.
struct __attribute((aligned(16))) stack_head {
void (*entry)(struct stack_head *);
// ...
};
The structure must have 16-byte alignment on all architectures. I used an
attribute to help keep this straight, and it can help when using sizeof
to place the structure, as I’ll demonstrate later.
Now for the cool part: The ...
can be anything you want! Use that area
to seed the new stack with whatever thread-local data is necessary. It’s a
neat feature you don’t get from standard thread spawning interfaces. If I
plan to “join” a thread later — wait until it’s done with its work — I’ll
put a join futex in this space:
struct __attribute((aligned(16))) stack_head {
void (*entry)(struct stack_head *);
int join_futex;
// ...
};
More details on that futex shortly.
I call the clone
wrapper newthread
. It has the inline assembly for the
system call, and since it includes a ret
to diverge the threads, it’s a
“naked” function just like with setjmp
. The compiler will
generate no prologue or epilogue, and the function body is limited to
inline assembly without input/output operands. It cannot even reliably
reference its parameters by name. Like clone
, it doesn’t accept a thread
entry point. Instead it accepts a stack_head
seeded with the entry
point. The whole wrapper is just six instructions:
__attribute((naked))
static long newthread(struct stack_head *stack)
{
__asm volatile (
"mov %%rdi, %%rsi\n" // arg2 = stack
"mov $0x50f00, %%edi\n" // arg1 = clone flags
"mov $56, %%eax\n" // SYS_clone
"syscall\n"
"mov %%rsp, %%rdi\n" // entry point argument
"ret\n"
: : : "rax", "rcx", "rsi", "rdi", "r11", "memory"
);
}
On x86-64, both function calls and system calls use rdi
and rsi
for
their first two parameters. Per the reference clone(2)
prototype above:
the first system call argument is flags
and the second argument is the
new stack
, which will point directly at the stack_head
. However, the
stack pointer arrives in rdi
. So I copy stack
into the second argument
register, rsi
, then load the flags (0x50f00
) into the first argument
register, rdi
. The system call number goes in rax
.
Where does that 0x50f00
come from? That’s the bare minimum thread spawn
flag set in hexadecimal. If any flag is missing then threads will not
spawn reliably — as discovered the hard way by trial and error across
different system configurations, not from documentation. It’s computed
normally like so:
long flags = 0;
flags |= CLONE_FILES;
flags |= CLONE_FS;
flags |= CLONE_SIGHAND;
flags |= CLONE_SYSVSEM;
flags |= CLONE_THREAD;
flags |= CLONE_VM;
When the system call returns, it copies the stack pointer into rdi
, the
first argument for the entry point. In the new thread the stack pointer
will be the same value as stack
, of course. In the old thread this is a
harmless no-op because rdi
is a volatile register in this ABI. Finally,
ret
pops the address at the top of the stack and jumps. In the old
thread this returns to the caller with the system call result, either an
error (negative errno) or the new thread ID. In the new thread
it pops the first element of stack_head
which, of course, is the
entry point. That’s why it must be first!
The thread has nowhere to return from the entry point, so when it’s done
it must either block indefinitely or use the exit
(not exit_group
)
system call to terminate itself.
The caller side looks something like this:
static void threadentry(struct stack_head *stack)
{
// ... do work ...
__atomic_store_n(&stack->join_futex, 1, __ATOMIC_SEQ_CST);
futex_wake(&stack->join_futex);
exit(0);
}
__attribute((force_align_arg_pointer))
void _start(void)
{
struct stack_head *stack = newstack(1<<16);
stack->entry = threadentry;
// ... assign other thread data ...
stack->join_futex = 0;
newthread(stack);
// ... do work ...
futex_wait(&stack->join_futex, 0);
exit_group(0);
}
Despite the minimalist, 6-instruction clone wrapper, this is taking the shape of a conventional threading API. It would only take a bit more to hide the futex, too. Speaking of which, what’s going on there? The same principal as a WaitGroup. The futex, an integer, is zero-initialized, indicating the thread is running (“not done”). The joiner tells the kernel to wait until the integer is non-zero, which it may already be since I don’t bother to check first. When the child thread is done, it atomically sets the futex to non-zero and wakes all waiters, which might be nobody.
Caveat: It’s not safe to free/reuse the stack after a successful join. It
only indicates the thread is done with its work, not that it exited. You’d
need to wait for its SIGCHLD
(or use CLONE_CHILD_CLEARTID
). If this
sounds like a problem, consider your context more carefully: Why do
you feel the need to free the stack? It will be freed when the process
exits. Worried about leaking stacks? Why are you starting and exiting an
unbounded number of threads? In the worst case park the thread in a thread
pool until you need it again. Only worry about this sort of thing if
you’re building a general purpose threading API like pthreads. I know it’s
tempting, but avoid doing that unless you absolutely must.
What’s with the force_align_arg_pointer
? Linux doesn’t align the stack
for the process entry point like a System V ABI function call. Processes
begin life with an unaligned stack. This attribute tells GCC to fix up the
stack alignment in the entry point prologue, just like on Windows.
If you want to access argc
, argv
, and envp
you’ll need more
assembly. (I wish doing really basic things without libc on Linux
didn’t require so much assembly.)
__asm (
".global _start\n"
"_start:\n"
" movl (%rsp), %edi\n"
" lea 8(%rsp), %rsi\n"
" lea 8(%rsi,%rdi,8), %rdx\n"
" call main\n"
" movl %eax, %edi\n"
" movl $60, %eax\n"
" syscall\n"
);
int main(int argc, char **argv, char **envp)
{
// ...
}
Getting back to the example usage, it has some regular-looking system call wrappers. Where do those come from? Start with this 6-argument generic system call wrapper.
long syscall6(long n, long a, long b, long c, long d, long e, long f)
{
register long ret;
register long r10 asm("r10") = d;
register long r8 asm("r8") = e;
register long r9 asm("r9") = f;
__asm volatile (
"syscall"
: "=a"(ret)
: "a"(n), "D"(a), "S"(b), "d"(c), "r"(r10), "r"(r8), "r"(r9)
: "rcx", "r11", "memory"
);
return ret;
}
I could define syscall5
, syscall4
, etc. but instead I’ll just wrap it
in macros. The former would be more efficient since the latter wastes
instructions zeroing registers for no reason, but for now I’m focused on
compacting the implementation source.
#define SYSCALL1(n, a) \
syscall6(n,(long)(a),0,0,0,0,0)
#define SYSCALL2(n, a, b) \
syscall6(n,(long)(a),(long)(b),0,0,0,0)
#define SYSCALL3(n, a, b, c) \
syscall6(n,(long)(a),(long)(b),(long)(c),0,0,0)
#define SYSCALL4(n, a, b, c, d) \
syscall6(n,(long)(a),(long)(b),(long)(c),(long)(d),0,0)
#define SYSCALL5(n, a, b, c, d, e) \
syscall6(n,(long)(a),(long)(b),(long)(c),(long)(d),(long)(e),0)
#define SYSCALL6(n, a, b, c, d, e, f) \
syscall6(n,(long)(a),(long)(b),(long)(c),(long)(d),(long)(e),(long)(f))
Now we can have some exits:
__attribute((noreturn))
static void exit(int status)
{
SYSCALL1(SYS_exit, status);
__builtin_unreachable();
}
__attribute((noreturn))
static void exit_group(int status)
{
SYSCALL1(SYS_exit_group, status);
__builtin_unreachable();
}
Simplified futex wrappers:
static void futex_wait(int *futex, int expect)
{
SYSCALL4(SYS_futex, futex, FUTEX_WAIT, expect, 0);
}
static void futex_wake(int *futex)
{
SYSCALL3(SYS_futex, futex, FUTEX_WAKE, 0x7fffffff);
}
And so on.
Finally I can talk about that newstack
function. It’s just a wrapper
around an anonymous memory map allocating pages from the kernel. I’ve
hardcoded the constants for the standard mmap allocation since they’re
nothing special or unusual. The return value check is a little tricky
since a large portion of the negative range is valid, so I only want to
check for a small range of negative errnos. (Allocating a arena looks
basically the same.)
static struct stack_head *newstack(long size)
{
unsigned long p = SYSCALL6(SYS_mmap, 0, size, 3, 0x22, -1, 0);
if (p > -4096UL) {
return 0;
}
long count = size / sizeof(struct stack_head);
return (struct stack_head *)p + count - 1;
}
The aligned
attribute comes into play here: I treat the result like an
array of stack_head
and return the last element. The attribute ensures
each individual elements is aligned.
That’s it! There’s not much to it other than a few thoughtful assembly instructions. It took doing this a few times in a few different programs before I noticed how simple it can be.
]]>If you want to skip ahead, here’s the full source, tests, and benchmark:
luhn.c
The Luhn algorithm isn’t just for credit card numbers, but they do make a nice target for a SWAR approach. The major payment processors use 16 digit numbers — i.e. 16 ASCII bytes — and typical machines today have 8-byte registers, so the input fits into two machine registers. In this context, the algorithm works like so:
Consider the digits number as an array, and double every other digit starting with the first. For example, 6543 becomes 12, 5, 8, 3.
Sum individual digits in each element. The example becomes 3 (i.e. 1+2), 5, 8, 3.
Sum the array mod 10. Valid inputs sum to zero. The example sums to 9.
I will implement this algorithm in C with this prototype:
int luhn(const char *s);
It assumes the input is 16 bytes and only contains digits, and it will return the Luhn sum. Callers either validate a number by comparing the result to zero, or use it to compute a check digit when generating a number. (Read: You could use SWAR to rapidly generate valid numbers.)
The plan is to process the 16-digit number in two halves, and so first
load the halves into 64-bit registers, which I’m calling hi
and lo
:
uint64_t hi =
(uint64_t)(s[ 0]&255) << 0 | (uint64_t)(s[ 1]&255) << 8 |
(uint64_t)(s[ 2]&255) << 16 | (uint64_t)(s[ 3]&255) << 24 |
(uint64_t)(s[ 4]&255) << 32 | (uint64_t)(s[ 5]&255) << 40 |
(uint64_t)(s[ 6]&255) << 48 | (uint64_t)(s[ 7]&255) << 56;
uint64_t lo =
(uint64_t)(s[ 8]&255) << 0 | (uint64_t)(s[ 9]&255) << 8 |
(uint64_t)(s[10]&255) << 16 | (uint64_t)(s[11]&255) << 24 |
(uint64_t)(s[12]&255) << 32 | (uint64_t)(s[13]&255) << 40 |
(uint64_t)(s[14]&255) << 48 | (uint64_t)(s[15]&255) << 56;
This looks complicated and possibly expensive, but it’s really just an idiom for loading a little endian 64-bit integer from a buffer. Breaking it down:
The input, *s
, is char
, which may be signed on some architectures. I
chose this type since it’s the natural type for strings. However, I do
not want sign extension, so I mask the low byte of the possibly-signed
result by ANDing with 255. It’s as though *s
was unsigned char
.
The shifts assemble the 64-bit result in little endian byte order regardless of the host machine byte order. In other words, this will produce correct results even on big endian hosts.
I chose little endian since it’s the natural byte order for all the architectures I care about. Big endian hosts may pay a cost on this load (byte swap instruction, etc.). The rest of the function could just as easily be computed over a big endian load if I was primarily targeting a big endian machine instead.
I could have used unsigned long long
(i.e. at least 64 bits) since
no part of this function requires exactly 64 bits. I chose uint64_t
since it’s succinct, and in practice, every implementation supporting
long long
also defines uint64_t
.
Both GCC and Clang figure this all out and produce perfect code. On x86-64, just one instruction for each statement:
mov rax, [rdi+0]
mov rdx, [rdi+8]
Or, more impressively, loading both using a single instruction on ARM64:
ldp x0, x1, [x0]
The next step is to decode ASCII into numeric values. This is trivial and
common in SWAR, and only requires subtracting '0'
(0x30
). So long
as there is no overflow, this can be done lane-wise.
hi -= 0x3030303030303030;
lo -= 0x3030303030303030;
Each byte of the register now contains values in 0–9. Next, double every other digit. Multiplication in SWAR is not easy, but doubling just means adding the odd lanes to themselves. I can mask out the lanes that are not doubled. Regarding the mask, recall that the least significant byte is the first byte (little endian).
hi += hi & 0x00ff00ff00ff00ff;
lo += lo & 0x00ff00ff00ff00ff;
Each byte of the register now contains values in 0–18. Now for the tricky problem of folding the tens place into the ones place. Unlike 8 or 16, 10 is not a particularly convenient base for computers, especially since SWAR lacks lane-wide division or modulo. Perhaps a lane-wise binary-coded decimal could solve this. However, I have a better trick up my sleeve.
Consider that the tens place is either 0 or 1. In other words, we really only care if the value in the lane is greater than 9. If I add 6 to each lane, the 5th bit (value 16) will definitely be set in any lanes that were previously at least 10. I can use that bit as the tens place.
hi += (hi + 0x0006000600060006)>>4 & 0x0001000100010001;
lo += (lo + 0x0006000600060006)>>4 & 0x0001000100010001;
This code adds 6 to the doubled lanes, shifts the 5th bit to the least significant position in the lane, masks for just that bit, and adds it lane-wise to the total. Only applying this to doubled lanes is a style decision, and I could have applied it to all lanes for free.
The astute might notice I’ve strayed from the stated algorithm. A lane that was holding, say, 12 now hold 13 rather than 3. Since the final result of the algorithm is modulo 10, leaving the tens place alone is harmless, so this is fine.
At this point each lane contains values in 0–19. Now that the tens processing is done, I can combine the halves into one register with a lane-wise sum:
hi += lo;
Each lane contains values in 0–38. I would have preferred to do this sooner, but that would have complicated tens place handling. Even if I had rotated the doubled lanes in one register to even out the sums, some lanes may still have had a 2 in the tens place.
The final step is a horizontal sum reduction using the typical SWAR approach. Add the top half of the register to the bottom half, then the top half of what’s left to the bottom half, etc.
hi += hi >> 32;
hi += hi >> 16;
hi += hi >> 8;
Before the sum I said each lane was 0–38, so couldn’t this sum be as high as 304 (8x38)? It would overflow the lane, giving an incorrect result. Fortunately the actual range is 0–18 for normal lanes and 0–38 for doubled lanes. That’s a maximum of 224, which fits in the result lane without overflow. Whew! I’ve been tracking the range all along to guard against overflow like this.
Finally mask the result lane and return it modulo 10:
return (hi&255) % 10;
On my machine, SWAR is around 3x faster than a straightforward digit-by-digit implementation.
int is_valid(const char *s)
{
return luhn(s) == 0;
}
void random_credit_card(char *s)
{
sprintf(s, "%015llu0", rand64()%1000000000000000);
s[15] = '0' + 10 - luhn(s);
}
Conveniently, all the SWAR operations translate directly into SSE2 instructions. If you understand the SWAR version, then this is easy to follow:
int luhn(const char *s)
{
__m128i r = _mm_loadu_si128((void *)s);
// decode ASCII
r = _mm_sub_epi8(r, _mm_set1_epi8(0x30));
// double every other digit
__m128i m = _mm_set1_epi16(0x00ff);
r = _mm_add_epi8(r, _mm_and_si128(r, m));
// extract and add tens digit
__m128i t = _mm_set1_epi16(0x0006);
t = _mm_add_epi8(r, t);
t = _mm_srai_epi32(t, 4);
t = _mm_and_si128(t, _mm_set1_epi8(1));
r = _mm_add_epi8(r, t);
// horizontal sum
r = _mm_sad_epu8(r, _mm_set1_epi32(0));
r = _mm_add_epi32(r, _mm_shuffle_epi32(r, 2));
return _mm_cvtsi128_si32(r) % 10;
}
On my machine, the SIMD version is around another 3x increase over SWAR, and so nearly an order of magnitude faster than a digit-by-digit implementation.
Update: Const-me on Hacker News suggests a better option for handling the tens digit in the function above, shaving off 7% of the function’s run time on my machine:
// if (digit > 9) digit -= 9
__m128i nine = _mm_set1_epi8(9);
__m128i gt = _mm_cmpgt_epi8(r, nine);
r = _mm_sub_epi8(r, _mm_and_si128(gt, nine));
Update: u/aqrit on reddit has come up with a more optimized SSE2 solution, 12% faster than mine on my machine:
int luhn(const char *s)
{
__m128i v = _mm_loadu_si128((void *)s);
__m128i m = _mm_cmpgt_epi8(_mm_set1_epi16('5'), v);
v = _mm_add_epi8(v, _mm_slli_epi16(v, 8));
v = _mm_add_epi8(v, m); // subtract 1 if less than 5
v = _mm_sad_epu8(v, _mm_setzero_si128());
v = _mm_add_epi32(v, _mm_shuffle_epi32(v, 2));
return (_mm_cvtsi128_si32(v) - 4) % 10;
// (('0' * 24) - 8) % 10 == 4
}
The other day I wanted try the famous memory reordering experiment for myself. It’s the double-slit experiment of concurrency, where a program can observe an “impossible” result on common hardware, as though a thread had time-traveled. While getting thread timing as tight as possible, I designed a possibly-novel thread barrier. It’s purely spin-locked, the entire footprint is a zero-initialized integer, it automatically resets, it can be used across processes, and the entire implementation is just three to four lines of code.
Here’s the entire barrier implementation for two threads in C11.
// Spin-lock barrier for two threads. Initialize *barrier to zero.
void barrier_wait(_Atomic uint32_t *barrier)
{
uint32_t v = ++*barrier;
if (v & 1) {
for (v &= 2; (*barrier&2) == v;);
}
}
Or in Go:
func BarrierWait(barrier *uint32) {
v := atomic.AddUint32(barrier, 1)
if v&1 == 1 {
v &= 2
for atomic.LoadUint32(barrier)&2 == v {
}
}
}
Even more, these two implementations are compatible with each other. C threads and Go goroutines can synchronize on a common barrier using these functions. Also note how it only uses two bits.
When I was done with my experiment, I did a quick search online for other spin-lock barriers to see if anyone came up with the same idea. I found a couple of subtly-incorrect spin-lock barriers, and some straightforward barrier constructions using a mutex spin-lock.
Before diving into how this works, and how to generalize it, let’s discuss the circumstance that let to its design.
Here’s the setup for the memory reordering experiment, where w0
and w1
are initialized to zero.
thread#1 thread#2
w0 = 1 w1 = 1
r1 = w1 r0 = w0
Considering all the possible orderings, it would seem that at least one of
r0
or r1
is 1. There seems to be no ordering where r0
and r1
could
both be 0. However, if raced precisely, this is a frequent or possibly
even majority occurrence on common hardware, including x86 and ARM.
How to go about running this experiment? These are concurrent loads and
stores, so it’s tempting to use volatile
for w0
and w1
. However,
this would constitute a data race — undefined behavior in at least C and
C++ — and so we couldn’t really reason much about the results, at least
not without first verifying the compiler’s assembly. These are variables
in a high-level language, not architecture-level stores/loads, even with
volatile
.
So my first idea was to use a bit of inline assembly for all accesses that would otherwise be data races. x86-64:
static int experiment(int *w0, int *w1)
{
int r1;
__asm volatile (
"movl $1, %1\n"
"movl %2, %0\n"
: "=r"(r1), "=m"(*w0)
: "m"(*w1)
);
return r1;
}
ARM64 (to try on my Raspberry Pi):
static int experiment(int *w0, int *w1)
{
int r1 = 1;
__asm volatile (
"str %w0, %1\n"
"ldr %w0, %2\n"
: "+r"(r1), "=m"(w0)
: "m"(w1)
);
return r1;
}
This is from the point-of-view of thread#1, but I can swap the arguments
for thread#2. I’m expecting this to be inlined, and encouraging it with
static
.
Alternatively, I could use C11 atomics with a relaxed memory order:
static int experiment(_Atomic int *w0, _Atomic int *w1)
{
atomic_store_explicit(w0, 1, memory_order_relaxed);
return atomic_load_explicit(w1, memory_order_relaxed);
}
Since this is a race and I want both threads to run their two experiment instructions as simultaneously as possible, it would be wise to use some sort of starting barrier… exactly the purpose of a thread barrier! It will hold the threads back until they’re both ready.
int w0, w1, r0, r1;
// thread#1 // thread#2
w0 = w1 = 0;
BARRIER; BARRIER;
r1 = experiment(&w0, &w1); r0 = experiment(&w1, &w0);
BARRIER; BARRIER;
if (!r0 && !r1) {
puts("impossible!");
}
The second thread goes straight into the barrier, but the first thread does a little more work to initialize the experiment and a little more at the end to check the result. The second barrier ensures they’re both done before checking.
Running this only once isn’t so useful, so each thread loops a few million times, hence the re-initialization in thread#1. The barriers keep them lockstep.
On my first attempt, I made the obvious decision for the barrier: I used
pthread_barrier_t
. I was already using pthreads for spawning the
extra thread, including on Windows, so this was convenient.
However, my initial results were disappointing. I only observed an “impossible” result around one in a million trials. With some debugging I determined that the pthreads barrier was just too damn slow, throwing off the timing. This was especially true with winpthreads, bundled with Mingw-w64, which in addition to the per-barrier mutex, grabs a global lock twice per wait to manage the barrier’s reference counter.
All pthreads implementations I used were quick to yield to the system scheduler. The first thread to arrive at the barrier would go to sleep, the second thread would wake it up, and it was rare they’d actually race on the experiment. This is perfectly reasonable for a pthreads barrier designed for the general case, but I really needed a spin-lock barrier. That is, the first thread to arrive spins in a loop until the second thread arrives, and it never interacts with the scheduler. This happens so frequently and quickly that it should only spin for a few iterations.
Spin locking means atomics. By default, atomics have sequentially
consistent ordering and will provide the necessary synchronization for the
non-atomic experiment variables. Stores (e.g. to w0
, w1
) made before
the barrier will be visible to all other threads upon passing through the
barrier. In other words, the initialization will propagate before either
thread exits the first barrier, and results propagate before either thread
exits the second barrier.
I know statically that there are only two threads, simplifying the implementation. The plan: When threads arrive, they atomically increment a shared variable to indicate such. The first to arrive will see an odd number, telling it to atomically read the variable in a loop until the other thread changes it to an even number.
At first with just two threads this might seem like a single bit would suffice. If the bit is set, the other thread hasn’t arrived. If clear, both threads have arrived.
void broken_wait1(_Atomic unsigned *barrier)
{
++*barrier;
while (*barrier&1);
}
Or to avoid an extra load, use the result directly:
void broken_wait2(_Atomic unsigned *barrier)
{
if (++*barrier & 1) {
while (*barrier&1);
}
}
Neither of these work correctly, and the other mutex-free barriers I found all have the same defect. Consider the broader picture: Between atomic loads in the first thread spin-lock loop, suppose the second thread arrives, passes through the barrier, does its work, hits the next barrier, and increments the counter. Both threads see an odd counter simultaneously and deadlock. No good.
To fix this, the wait function must also track the phase. The first barrier is the first phase, the second barrier is the second phase, etc. Conveniently the rest of the integer acts like a phase counter! Writing this out more explicitly:
void barrier_wait(_Atomic unsigned *barrier)
{
unsigned observed = ++*barrier;
unsigned thread_count = observed & 1;
if (thread_count != 0) {
// not last arrival, watch for phase change
unsigned init_phase = observed >> 1;
for (;;) {
unsigned current_phase = *barrier >> 1;
if (current_phase != init_phase) {
break;
}
}
}
}
The key: When the last thread arrives, it overflows the thread counter to zero and increments the phase counter in one operation.
By the way, I’m using unsigned
since it may eventually overflow, and
even _Atomic int
overflow is undefined for the ++
operator. However,
if you use atomic_fetch_add
or C++ std::atomic
then overflow is
defined and you can use int
.
Threads can never be more than one phase apart by definition, so only one
bit is needed for the phase counter, making this effectively a two-phase,
two-bit barrier. In my final implementation, rather than shift (>>
), I
mask (&
) the phase bit with 2.
With this spin-lock barrier, the experiment observes r0 = r1 = 0
in ~10%
of trials on my x86 machines and ~75% of trials on my Raspberry Pi 4.
Two threads required two bits. This generalizes to log2(n)+1
bits for
n
threads, where n
is a power of two. You may have already figured out
how to support more threads: spend more bits on the thread counter.
// Spin-lock barrier for n threads, where n is a power of two.
// Initialize *barrier to zero.
void barrier_waitn(_Atomic unsigned *barrier, int n)
{
unsigned v = ++*barrier;
if (v & (n - 1)) {
for (v &= n; (*barrier&n) == v;);
}
}
Note: It never makes sense for n
to exceed the logical core count!
If it does, then at least one thread must not be actively running. The
spin-lock ensures it does not get scheduled promptly, and the barrier will
waste lots of resources doing nothing in the meantime.
If the barrier is used little enough that you won’t overflow the overall
barrier integer — maybe just use a uint64_t
— an implementation could
support arbitrary thread counts with the same principle using modular
division instead of the &
operator. The denominator is ideally a
compile-time constant in order to avoid paying for division in the
spin-lock loop.
While C11 _Atomic
seems like it would be useful, unsurprisingly it is
not supported by one major, stubborn implementation. If you’re
using C++11 or later, then go ahead use std::atomic<int>
since it’s
well-supported. In real, practical C programs, I will continue using dual
implementations: interlocked functions on MSVC, and GCC built-ins (also
supported by Clang) everywhere else.
#if __GNUC__
# define BARRIER_INC(x) __atomic_add_fetch(x, 1, __ATOMIC_SEQ_CST)
# define BARRIER_GET(x) __atomic_load_n(x, __ATOMIC_SEQ_CST)
#elif _MSC_VER
# define BARRIER_INC(x) _InterlockedIncrement(x)
# define BARRIER_GET(x) _InterlockedOr(x, 0)
#endif
// Spin-lock barrier for n threads, where n is a power of two.
// Initialize *barrier to zero.
static void barrier_wait(int *barrier, int n)
{
int v = BARRIER_INC(barrier);
if (v & (n - 1)) {
for (v &= n; (BARRIER_GET(barrier)&n) == v;);
}
}
This has the nice bonus that the interface does not have the _Atomic
qualifier, nor std::atomic
template. It’s just a plain old int
, making
the interface simpler and easier to use. It’s something I’ve grown to
appreciate from Go.
If you’d like to try the experiment yourself: reorder.c
. If
you’d like to see a test of Go and C sharing a thread barrier:
coop.go
.
I’m intentionally not providing the spin-lock barrier as a library. First, it’s too trivial and small for that, and second, I believe context is everything. Now that you understand the principle, you can whip up your own, custom-tailored implementation when the situation calls for it, just as the one in my experiment is hard-coded for exactly two threads.
]]>Unix-like systems pass the argv
array directly from parent to child. On
Linux it’s literally copied onto the child’s stack just above the stack
pointer on entry. The runtime just bumps the stack pointer address a few
bytes and calls it argv
. Here’s a minimalist x86-64 Linux runtime in
just 6 instructions (22 bytes):
_start: mov edi, [rsp] ; argc
lea rsi, [rsp+8] ; argv
call main
mov edi, eax
mov eax, 60 ; SYS_exit
syscall
It’s 5 instructions (20 bytes) on ARM64:
_start: ldr w0, [sp] ; argc
add x1, sp, 8 ; argv
bl main
mov w8, 93 ; SYS_exit
svc 0
On Windows, argv
is passed in serialized form as a string. That’s how
MS-DOS did it (via the Program Segment Prefix), because that’s how
CP/M did it. It made more sense when processes were mostly launched
directly by humans: The string was literally typed by a human operator,
and somebody has to parse it after all. Today, processes are nearly
always launched by other programs, but despite this, must still serialize
the argument array into a string as though a human had typed it out.
Windows itself provides an operating system routine for parsing command
line strings: CommandLineToArgvW. Fetch the command line string
with GetCommandLineW, pass it to this function, and you have your
argc
and argv
. Plus maybe LocalFree to clean up. It’s only available
in “wide” form, so if you want to work in UTF-8 you’ll also need
WideCharToMultiByte
. It’s around 20 lines of C rather than 6 lines of
assembly, but it’s not too bad.
GetCommandLineW returns a pointer into static storage, which is why it
doesn’t need to be freed. More specifically, it comes from the Process
Environment Block. This got me thinking: Could I locate this address
myself without the API call? First I needed to find the PEB. After some
research I found a PEB pointer in the Thread Information Block,
itself found via the gs
register (x64, fs
on x86), an old 386 segment
register. Buried in the PEB is a UNICODE_STRING
, with the
command line string address. I worked out all the offsets for both x86 and
x64, and the whole thing is just three instructions:
wchar_t *cmdline_fetch(void)
{
void *cmd = 0;
#if __amd64
__asm ("mov %%gs:(0x60), %0\n"
"mov 0x20(%0), %0\n"
"mov 0x78(%0), %0\n"
: "=r"(cmd));
#elif __i386
__asm ("mov %%fs:(0x30), %0\n"
"mov 0x10(%0), %0\n"
"mov 0x44(%0), %0\n"
: "=r"(cmd));
#endif
return cmd;
}
From Windows XP through Windows 11, this returns exactly the same address
as GetCommandLineW. There’s little reason to do it this way other than to
annoy Raymond Chen, but it’s still neat and maybe has some super niche
use. Technically some of these offsets are undocumented and/or subject to
change, except Microsoft’s own static link CRT also hardcodes all these
offsets. It’s easy to find: disassemble any statically linked program,
look for the gs
register, and you’ll find it using these offsets, too.
If you look carefully at the UNICODE_STRING
you’ll see the length is
given by a USHORT
in units of bytes, despite being a 16-bit wchar_t
string. This is the source of Windows’ maximum command line length
of 32,767 characters (including terminator).
GetCommandLineW is from kernel32.dll
, but CommandLineToArgvW is a bit
more off the beaten path in shell32.dll
. If you wanted to avoid linking
to shell32.dll
for important reasons, you’d need to do the
command line parsing yourself. Many runtimes, including Microsoft’s own
CRTs, don’t call CommandLineToArgvW and instead do their own parsing. It’s
messier than I expected, and when I started digging into it I wasn’t
expecting it to involve a few days of research.
The GetCommandLineW has a rough explanation: split arguments on whitespace (not defined), quoting is involved, and there’s something about counting backslashes, but only if they stop on a quote. It’s not quite enough to implement your own, and if you test against it, it’s quickly apparent that this documentation is at best incomplete. It links to a deprecated page about parsing C++ command line arguments with a few more details. Unfortunately the algorithm described on this page is not the algorithm used by GetCommandLineW, nor is it used by any runtime I could find. It even varies between Microsoft’s own CRTs. There is no canonical command line parsing result, not even a de facto standard.
I eventually came across David Deley’s How Command Line Parameters Are
Parsed, which is the closest there is to an authoritative document on
the matter (also). Unfortunately it focuses on runtimes rather
than CommandLineToArgvW, and so some of those details aren’t captured. In
particular, the first argument (i.e. argv[0]
) follows entirely different
rules, which really confused me for while. The Wine documentation
was helpful particularly for CommandLineToArgvW. As far as I can tell,
they’ve re-implemented it perfectly, matching it bug-for-bug as they do.
Before finding any of this, I started building my own implementation,
which I now believe matches CommandLineToArgvW. These other documents
helped me figure out what I was missing. In my usual fashion, it’s a
little state machine: cmdline.c
. The interface:
int cmdline_to_argv8(const wchar_t *cmdline, char **argv);
Unlike the others, mine encodes straight into WTF-8, a superset of UTF-8 that can round-trip ill-formed UTF-16. The WTF-8 part is negative lines of code: invisible since it involves not reacting to ill-formed input. If you use the new-ish UTF-8 manifest Win32 feature then your program cannot handle command line strings with ill-formed UTF-16, a problem solved by WTF-8.
As documented, that argv
must be a particular size — a pointer-aligned,
224kB (x64) or 160kB (x86) buffer — which covers the absolute worst case.
That’s not too bad when the command line is limited to 32,766 UTF-16
characters. The worst case argument is a single long sequence of 3-byte
UTF-8. 4-byte UTF-8 requires 2 UTF-16 code points, so there would only be
half as many. The worst case argc
is 16,383 (plus one more argv
slot
for the null pointer terminator), which is one argument for each pair of
command line characters. The second half (roughly) of the argv
is
actually used as a char
buffer for the arguments, so it’s all a single,
fixed allocation. There is no error case since it cannot fail.
int mainCRTStartup(void)
{
static char *argv[CMDLINE_ARGV_MAX];
int argc = cmdline_to_argv8(cmdline_fetch(), argv);
return main(argc, argv);
}
Also: Note the FUZZ
option in my source. It has been pretty thoroughly
fuzz tested. It didn’t find anything, but it does make me more
confident in the result.
I also peeked at some language runtimes to see how others handle it. Just as expected, Mingw-w64 has the behavior of an old (pre-2008) Microsoft CRT. Also expected, CPython implicitly does whatever the underlying C runtime does, so its exact command line behavior depends on which version of Visual Studio was used to build the Python binary. OpenJDK pragmatically calls CommandLineToArgvW. Go (gc) does its own parsing, with behavior mixed between CommandLineToArgvW and some of Microsoft’s CRTs, but not quite matching either.
I’ve always been boggled as to why there’s no complementary inverse to
CommandLineToArgvW. When spawning processes with arbitrary arguments,
everyone is left to implement the inverse of this under-specified and
non-trivial command line format to serialize an argv
. Hopefully the
receiver parses it compatibly! There’s no falling back on a system routine
to help out. This has lead to a lot of repeated effort: it’s not limited
to high level runtimes, but almost any extensible application (itself a
kind of runtime). Fortunately serializing is not quite as complex as
parsing since many of the edge cases simply don’t come up if done in a
straightforward way.
Naturally, I also wrote my own implementation (same source):
int cmdline_from_argv8(wchar_t *cmdline, int len, char **argv);
Like before, it accepts a WTF-8 argv
, meaning it can correctly pass
through ill-formed UTF-16 arguments. It returns the actual command line
length. Since this one can fail when argv
is too large, it returns
zero for an error.
char *argv[] = {"python.exe", "-c", code, 0};
wchar_t cmd[CMDLINE_CMD_MAX];
if (!cmdline_from_argv8(cmd, CMDLINE_CMD_MAX, argv)) {
return "argv too large";
}
if (!CreateProcessW(0, cmd, /*...*/)) {
return "CreateProcessW failed";
}
How do others handle this?
The aged Emacs implementation is written in C rather than Lisp, steeped in history with vestigial wrong turns. Emacs still only calls the “narrow” CreateProcessA despite having every affordance to do otherwise, and uses the wrong encoding at that. A personal source of headaches.
CPython uses Python rather than C via subprocess.list2cmdline
.
While undocumented, it’s accessible on any platform and easy to
test against various inputs. Try it out!
Go (gc) is just as delightfully boring I’d expect.
OpenJDK optimistically optimizes for command line strings under 80 bytes, and like Emacs, displays the weathering of long use.
I don’t plan to write a language implementation anytime soon, where this might be needed, but it’s nice to know I’ve already solved this problem for myself!
]]>The primary Go implementation, confusingly named “gc”, is an incredible piece of software engineering. This is apparent when building the Go toolchain itself, a process that is fast, reliable, easy, and simple. It was originally written in C, but was re-written in Go starting with Go 1.5. The C compiler in w64devkit can build the original C implementation which then can be used to bootstrap any more recent version. It’s so easy that I personally never use official binary releases and always bootstrap from source.
You will need the Go 1.4 source, go1.4-bootstrap-20171003.tar.gz. This “bootstrap” tarball is the last Go 1.4 release plus a few additional bugfixes. You will also need the source of the actual version of Go you want to use, such as Go 1.16.5 (latest version as of this writing).
Start by building Go 1.4 using w64devkit. On Windows, Go is built using a
batch script and no special build system is needed. Since it shouldn’t be
invoked with the BusyBox ash shell, I use cmd.exe
explicitly.
$ tar xf go1.4-bootstrap-20171003.tar.gz
$ mv go/ bootstrap
$ (cd bootstrap/src/ && cmd /c make)
In about 30 seconds you’ll have a fully-working Go 1.4 toolchain. Next use it to build the desired toolchain. You can move this new toolchain after it’s built if necessary.
$ export GOROOT_BOOTSTRAP="$PWD/bootstrap"
$ tar xf go1.16.5.src.tar.gz
$ (cd go/src/ && cmd /c make)
At this point you can delete the bootstrap toolchain. You probably also want to put Go on your PATH.
$ rm -rf bootstrap/
$ printf 'PATH="$PATH;%s/go/bin"\n' "$PWD" >>~/.profile
$ source ~/.profile
Not only is Go now available, so is the full power of cgo. (Including its costs if used.)
Since w64devkit is oriented so much around Vim, here’s my personal Vim
configuration for Go. I don’t need or want fancy plugins, just access to
goimports
and a couple of corrections to Vim’s built-in Go support ([[
and ]]
navigation). The included ctags
understands Go, so tags
navigation works the same as it does with C. \i
saves the current
buffer, runs goimports
, and populates the quickfix list with any errors.
Similarly :make
invokes go build
and, as expected, populates the
quickfix list.
autocmd FileType go setlocal makeprg=go\ build
autocmd FileType go map <silent> <buffer> <leader>i
\ :update \|
\ :cexpr system("goimports -w " . expand("%")) \|
\ :silent edit<cr>
autocmd FileType go map <buffer> [[
\ ?^\(func\\|var\\|type\\|import\\|package\)\><cr>
autocmd FileType go map <buffer> ]]
\ /^\(func\\|var\\|type\\|import\\|package\)\><cr>
Go only comes with gofmt
but goimports
is just one command away, so
there’s little excuse not to have it:
$ go install golang.org/x/tools/cmd/goimports@latest
Thanks to GOPROXY, all Go dependencies are accessible without (or before) installing Git, so this tool installation works with nothing more than w64devkit and a bootstrapped Go toolchain.
The intricacies of cgo are beyond the scope of this article, but the gist
is that a Go source file contains C source in a comment followed by
import "C"
. The imported C
object provides access to C types and
functions. Go functions marked with an //export
comment, as well as the
commented C code, are accessible to C. The latter means we can use Go to
implement a C interface in a DLL, and the caller will have no idea they’re
actually talking to Go.
To illustrate, here’s an little C interface. To keep it simple, I’ve specifically sidestepped some more complicated issues, particularly involving memory management.
// Which DLL am I running?
int version(void);
// Generate 64 bits from a CSPRNG.
unsigned long long rand64(void);
// Compute the Euclidean norm.
float dist(float x, float y);
Here’s a C implementation which I’m calling “version 1”.
#include <math.h>
#include <windows.h>
#include <ntsecapi.h>
__declspec(dllexport)
int
version(void)
{
return 1;
}
__declspec(dllexport)
unsigned long long
rand64(void)
{
unsigned long long x;
RtlGenRandom(&x, sizeof(x));
return x;
}
__declspec(dllexport)
float
dist(float x, float y)
{
return sqrtf(x*x + y*y);
}
As discussed in the previous article, each function is exported using
__declspec
so that they’re available for import. As before:
$ cc -shared -Os -s -o hello1.dll hello1.c
Side note: This could be trivially converted into a C++ implementation
just by adding extern "C"
to each declaration. It disables C++ features
like name mangling, and follows the C ABI so that the C++ functions appear
as C functions. Compiling the C++ DLL is exactly the same.
Suppose we wanted to implement this in Go instead of C. We already have all the tools needed to do so. Here’s a Go implementation, “version 2”:
package main
import "C"
import (
"crypto/rand"
"encoding/binary"
"math"
)
//export version
func version() C.int {
return 2
}
//export rand64
func rand64() C.ulonglong {
var buf [8]byte
rand.Read(buf[:])
r := binary.LittleEndian.Uint64(buf[:])
return C.ulonglong(r)
}
//export dist
func dist(x, y C.float) C.float {
return C.float(math.Sqrt(float64(x*x + y*y)))
}
func main() {
}
Note the use of C types for all arguments and return values. The main
function is required since this is the main package, but it will never be
called. The DLL is built like so:
$ go build -buildmode=c-shared -o hello2.dll hello2.go
Without the -o
option, the DLL will lack an extension. This works fine
since it’s mostly only convention on Windows, but it may be confusing
without it.
What if we need an import library? This will be required when linking with
the MSVC toolchain. In the previous article we asked Binutils to generate
one using --out-implib
. For Go we have to handle this ourselves via
gendef
and dlltool
.
$ gendef hello2.dll
$ dlltool -l hello2.lib -d hello2.def
The only way anyone upgrading would know version 2 was implemented in Go is that the DLL is a lot bigger (a few MB vs. a few kB) since it now contains an entire Go runtime.
We could also go the other direction and implement the DLL using plain assembly. It won’t even require linking against a C runtime.
w64devkit includes two assemblers: GAS (Binutils) which is used by GCC, and NASM which has friendlier syntax. I prefer the latter whenever possible — exactly why I included NASM in the distribution. So here’s how I implemented “version 3” in NASM assembly.
bits 64
section .text
global DllMainCRTStartup
export DllMainCRTStartup
DllMainCRTStartup:
mov eax, 1
ret
global version
export version
version:
mov eax, 3
ret
global rand64
export rand64
rand64:
rdrand rax
ret
global dist
export dist
dist:
mulss xmm0, xmm0
mulss xmm1, xmm1
addss xmm0, xmm1
sqrtss xmm0, xmm0
ret
The global
directive is common in NASM assembly and causes the named
symbol to have the external linkage needed when linking the DLL. The
export
directive is Windows-specific and is equivalent to dllexport
in
C.
Every DLL must have an entrypoint, usually named DllMainCRTStartup
. The
return value indicates if the DLL successfully loaded. So far this has
been handled automatically by the C implementation, but at this low level
we must define it explicitly.
Here’s how to assemble and link the DLL:
$ nasm -fwin64 -o hello3.o hello3.s
$ ld -shared -s -o hello3.dll hello3.o
Python has a nice, built-in C interop, ctypes
, that allows Python to
call arbitrary C functions in shared libraries, including DLLs, without
writing C to glue it together. To tie this all off, here’s a Python
program that loads all of the DLLs above and invokes each of the
functions:
import ctypes
def load(version):
hello = ctypes.CDLL(f"./hello{version}.dll")
hello.version.restype = ctypes.c_int
hello.version.argtypes = ()
hello.dist.restype = ctypes.c_float
hello.dist.argtypes = (ctypes.c_float, ctypes.c_float)
hello.rand64.restype = ctypes.c_ulonglong
hello.rand64.argtypes = ()
return hello
for hello in load(1), load(2), load(3):
print("version", hello.version())
print("rand ", f"{hello.rand64():016x}")
print("dist ", hello.dist(3, 4))
After loading the DLL with CDLL
the program defines each function
prototype so that Python knows how to call it. Unfortunately it’s not
possible to build Python with w64devkit, so you’ll also need to install
the standard CPython distribution in order to run it. Here’s the output:
$ python finale.py
version 1
rand b011ea9bdbde4bdf
dist 5.0
version 2
rand f7c86ff06ae3d1a2
dist 5.0
version 3
rand 2a35a05b0482c898
dist 5.0
That output is the result of four different languages interfacing in one process: C, Go, x86-64 assembly, and Python. Pretty neat if you ask me!
]]>The same advice also often applies to compilers.
Suppose you need to XOR two, non-overlapping 64-byte (512-bit) blocks of data. The simplest approach would be to do it a byte at a time:
/* XOR src into dst */
void
xor512a(void *dst, void *src)
{
unsigned char *pd = dst;
unsigned char *ps = src;
for (int i = 0; i < 64; i++) {
pd[i] ^= ps[i];
}
}
Maybe you benchmark it or you look at the assembly output, and the
results are disappointing. Your compiler did exactly what you asked
of it and produced code that performs 64 single-byte XOR operations
(GCC 9.2.0, x86-64, -Os
):
xor512a:
xor eax, eax
.L0: mov cl, [rsi+rax]
xor [rdi+rax], cl
inc rax
cmp rax, 64
jne .L0
ret
The target architecture has wide registers so it could be doing at least 8 bytes at a time. Since your compiler isn’t doing it, you decide to chunk the work into 8 byte blocks yourself in an attempt to manually implement a chunking operation. Here’s some real world code that does so:
/* WARNING: Broken, do not use! */
void
xor512b(void *dst, void *src)
{
uint64_t *pd = dst;
uint64_t *ps = src;
for (int i = 0; i < 8; i++) {
pd[i] ^= ps[i];
}
}
You check the assembly output of this function, and it looks much better. It’s now processing 8 bytes at a time, so it should be about 8 times faster than before.
xor512b:
xor eax, eax
.L0: mov rcx, [rsi+rax*8]
xor [rdi+rax*8], rcx
inc rax
cmp rax, 8
jne .L0
ret
Still, this machine has 16-byte wide registers (SSE2 xmm
), so there
could be another doubling in speed. Oh well, this is good enough, so you
plug it into your program. But something strange happens: The output
is now wrong!
int
main(void)
{
uint32_t dst[32] = {
1, 2, 3, 4, 5, 6, 7, 8,
9, 10, 11, 12, 13, 14, 15, 16
};
uint32_t src[32] = {
1, 4, 9, 16, 25, 36, 49, 64,
81, 100, 121, 144, 169, 196, 225, 256,
};
xor512b(dst, src);
for (int i = 0; i < 16; i++) {
printf("%d\n", (int)dst[i]);
}
}
Your program prints 1..16 as if xor512b()
was never called. You check
over everything a dozen times, and you can’t find anything wrong. Even
crazier, if you disable optimizations then the bug goes away. It must be
some kind of compiler bug!
Investigating a bit more, you learn that the -fno-strict-aliasing
option also fixes the bug. That’s because this program violates C strict
aliasing rules. An array of uint32_t
was accessed as a uint64_t
. As
an important optimization, compilers are allowed to assume such
variables do not alias and generate code accordingly. Otherwise every
memory store could potentially modify any variable, which limits the
compiler’s ability to produce decent code.
The original version is fine because char *
, including both signed
and unsigned
, has a special exemption and may alias with anything. For
the same reason, using char *
unnecessarily can also make your
programs slower.
What could you do to keep the chunking operation while not running afoul
of strict aliasing? Counter-intuitively, you could use memcpy()
. Copy
the chunks into legitimate, local uint64_t
variables, do the work, and
copy the result back out.
void
xor512c(void *dst, void *src)
{
for (int i = 0; i < 8; i++) {
uint64_t buf[2];
memcpy(buf + 0, (char *)dst + i*8, 8);
memcpy(buf + 1, (char *)src + i*8, 8);
buf[0] ^= buf[1];
memcpy((char *)dst + i*8, buf, 8);
}
}
Since memcpy()
is a built-in function, your compiler knows its
semantics and can ultimately elide all that copying. The assembly
listing for xor512c
is identical to xor512b
, but it won’t go haywire
when integrated into a real program.
It works and it’s correct, but you can still do much better than this!
The problem is you’re forcing the knife and not letting it do the work. There’s a constraint on your compiler that hasn’t been considered: It must work correctly for overlapping inputs.
char buf[74] = {...};
xor512a(buf, buf + 10);
In this situation, the byte-by-byte and chunked versions of the function will have different results. That’s exactly why your compiler can’t do the chunking operation itself. However, you don’t care about this situation because the inputs never overlap.
Let’s revisit the first, simple implementation, but this time being
smarter about it. The restrict
keyword indicates that the inputs
will not overlap, freeing your compiler of this unwanted concern.
void
xor512d(void *restrict dst, void *restrict src)
{
unsigned char *pd = dst;
unsigned char *ps = src;
for (int i = 0; i < 64; i++) {
pd[i] ^= ps[i];
}
}
(Side note: Adding restrict
to the manually chunked function,
xor512b()
, will not fix it. Using restrict
can never make an
incorrect program correct.)
Compiled with GCC 9.2.0 and -O3
, the resulting unrolled code
processes 16-byte chunks at a time (pxor
):
xor512d:
movdqu xmm0, [rdi+0x00]
movdqu xmm1, [rsi+0x00]
movdqu xmm2, [rsi+0x10]
movdqu xmm3, [rsi+0x20]
pxor xmm0, xmm1
movdqu xmm4, [rdi+0x30]
movups [rdi+0x00], xmm0
movdqu xmm0, [rdi+0x10]
pxor xmm0, xmm2
movups [rdi+0x10], xmm0
movdqu xmm0, [rdi+0x20]
pxor xmm0, xmm3
movups [rdi+0x20], xmm0
movdqu xmm0, [rsi+0x30]
pxor xmm0, xmm4
movups [rdi+0x30], xmm0
ret
Compiled with Clang 9.0.0 with AVX-512 enabled in the target
(-mavx512bw
), it does the entire operation in a single, big chunk!
xor512d:
vmovdqu64 zmm0, [rdi]
vpxorq zmm0, zmm0, [rsi]
vmovdqu64 [rdi], zmm0
vzeroupper
ret
“Letting the knife do the work” means writing a correct program and lifting unnecessary constraints so that the compiler can use whatever chunk size is appropriate for the target.
]]>In software development there are many concepts that at first glance seem useful and sound, but, after considering the consequences of their implementation and use, are actually horrifying. Examples include thread cancellation, variable length arrays, and memory aliasing. GCC’s closure extension to C is another, and this little feature compromises the entire GNU toolchain.
GCC has its own dialect of C called GNU C. One feature unique to GNU C is nested functions, which allow C programs to define functions inside other functions:
void intsort1(int *base, size_t nmemb)
{
int cmp(const void *a, const void *b)
{
return *(int *)a - *(int *)b;
}
qsort(base, nmemb, sizeof(*base), cmp);
}
The nested function above is straightforward and harmless. It’s nothing
groundbreaking, and it is trivial for the compiler to implement. The
cmp
function is really just a static function whose scope is limited
to the containing function, no different than a local static variable.
With one slight variation the nested function turns into a closure. This is where things get interesting:
void intsort2(int *base, size_t nmemb, _Bool invert)
{
int cmp(const void *a, const void *b)
{
int r = *(int *)a - *(int *)b;
return invert ? -r : r;
}
qsort(base, nmemb, sizeof(*base), cmp);
}
The invert
variable from the outer scope is accessed from the inner
scope. This has clean, proper closure semantics and works
correctly just as you’d expect. It fits quite well with traditional C
semantics. The closure itself is re-entrant and thread-safe. It’s
automatically (read: stack) allocated, and so it’s automatically freed
when the function returns, including when the stack is unwound via
longjmp()
. It’s a natural progression to support closures like this
via nested functions. The eventual caller, qsort
, doesn’t even know
it’s calling a closure!
While this seems so useful and easy, its implementation has serious consequences that, in general, outweigh its benefits. In fact, in order to make this work, the whole GNU toolchain has been specially rigged!
How does it work? The function pointer, cmp
, passed to qsort
must
somehow be associated with its lexical environment, specifically the
invert
variable. A static address won’t do. When I implemented
closures as a toy library, I talked about the function address for
each closure instance somehow needing to be unique.
GCC accomplishes this by constructing a trampoline on the stack. That
trampoline has access to the local variables stored adjacent to it, also
on the stack. GCC also generates a normal cmp
function, like the
simple nested function before, that accepts invert
as an additional
argument. The trampoline calls this function, passing the local variable
as this additional argument.
To illustrate this, I’ve manually implemented intsort2()
below for
x86-64 (System V ABI) without using GCC’s nested function
extension:
int cmp(const void *a, const void *b, _Bool invert)
{
int r = *(int *)a - *(int *)b;
return invert ? -r : r;
}
void intsort3(int *base, size_t nmemb, _Bool invert)
{
unsigned long fp = (unsigned long)cmp;
volatile unsigned char buf[] = {
// mov edx, invert
0xba, invert, 0x00, 0x00, 0x00,
// mov rax, cmp
0x48, 0xb8, fp >> 0, fp >> 8, fp >> 16, fp >> 24,
fp >> 32, fp >> 40, fp >> 48, fp >> 56,
// jmp rax
0xff, 0xe0
};
int (*trampoline)(const void *, const void *) = (void *)buf;
qsort(base, nmemb, sizeof(*base), trampoline);
}
Here’s a complete example you can try yourself on nearly any x86-64 unix-like system: trampoline.c. It even works with Clang. The two notable systems where stack trampolines won’t work are OpenBSD and WSL.
(Note: The volatile
is necessary because C compilers rightfully do
not see the contents of buf
as being consumed. Execution of the
contents isn’t considered.)
In case you hadn’t already caught it, there’s a catch. The linker needs
to link a binary that asks the loader for an executable stack (-z
execstack
):
$ cc -std=c99 -Os -Wl,-z,execstack trampoline.c
That’s because buf
contains x86 code implementing the trampoline:
mov edx, invert ; assign third argument
mov rax, cmp ; store cmp address in RAX register
jmp rax ; jump to cmp
(Note: The absolute jump through a 64-bit register is necessary because
the trampoline on the stack and the jump target will be very far apart.
Further, these days the program will likely be compiled as a Position
Independent Executable (PIE), so cmp
might itself have an high
address rather than load into the lowest 32 bits of the address
space.)
However, executable stacks were phased out ~15 years ago because it makes buffer overflows so much more dangerous! Attackers can inject and execute whatever code they like, typically shellcode. That’s why we need this unusual linker option.
You can see that the stack will be executable using our old friend,
readelf
:
$ readelf -l a.out
...
GNU_STACK 0x00000000 0x00000000 0x00000000
0x00000000 0x00000000 RWE 0x10
...
Note the “RWE” at the bottom right, meaning read-write-execute. This is a really bad sign in a real binary. Do any binaries installed on your system right now have an executable stack? I found one on mine. (Update: A major one was found in the comments by Walter Misar.)
When compiling the original version using a nested function there’s no need for that special linker option. That’s because GCC saw that it would need an executable stack and used this option automatically.
Or, more specifically, GCC stopped requesting a non-executable stack in the object file it produced. For the GNU Binutils linker, the default is an executable stack.
Since this is the default, the only way to get a non-executable stack is
if every object file input to the linker explicitly declares that it
does not need an executable stack. To request a non-executable stack, an
object file must contain the (empty) section .note.GNU-stack
.
If even a single object file fails to do this, then the final program
gets an executable stack.
Not only does one contaminated object file infect the binary, everything
dynamically linked with it also gets an executable stack. Entire
processes are infected! This occurs even via dlopen()
, where the stack
is dynamically made executable to accomodate the new shared object.
I’ve been bit myself. In Baking Data with Serialization I did it completely by accident, and I didn’t notice my mistake until three years later. The GNU linker outputs object files without the special note by default even though the object file only contains data.
$ echo hello world >hello.txt
$ ld -r -b binary -o hello.o hello.txt
$ readelf -S hello.o | grep GNU-stack
$
This is fixed with -z noexecstack
:
$ ld -r -b binary -z noexecstack -o hello.o hello.txt
$ readelf -S hello.o | grep GNU-stack
[ 2] .note.GNU-stack PROGBITS 00000000 0000004c
$
This may happen any time you link object files not produced by GCC, such as output from the NASM assembler or hand-crafted object files.
Nested C closures are super slick, but they’re just not worth the risk of an executable stack, and they’re certainly not worth an entire toolchain being fail open about it.
Update: A rebuttal. My short response is that the issue discussed in my article isn’t really about C the language but rather about an egregious issue with one particular toolchain. The problem doesn’t even arise if you use only C, but instead when linking in object files specifically not derived from C code.
]]>Specifying a particular behavior would have put unnecessary burden on implementations — especially in the earlier days of computing — making for inefficient programs on some platforms. For example, if the result of dereferencing a null pointer was defined to trap — to cause the program to halt with an error — then platforms that do not have hardware trapping, such as those without virtual memory, would be required to instrument, in software, each pointer dereference.
In the 21st century, undefined behavior has taken on a somewhat different meaning. Optimizers use it — or abuse it depending on your point of view — to lift constraints that would otherwise inhibit more aggressive optimizations. It’s not so much a fundamentally different application of undefined behavior, but it does take the concept to an extreme.
The reasoning works like this: A program that evaluates a construct whose behavior is undefined cannot, by definition, have any meaningful behavior, and so that program would be useless. As a result, compilers assume programs never invoke undefined behavior and use those assumptions to prove its optimizations.
Under this newer interpretation, mistakes involving undefined behavior are more punishing and surprising than before. Programs that seem to make some sense when run on a particular architecture may actually compile into a binary with a security vulnerability due to conclusions reached from an analysis of its undefined behavior.
This can be frustrating if your programs are intended to run on a very specific platform. In this situation, all behavior really could be locked down and specified in a reasonable, predictable way. Such a language would be like an extended, less portable version of C or C++. But your toolchain still insists on running your program on the abstract machine rather than the hardware you actually care about. However, even in this situation undefined behavior can still be desirable. I will provide a couple of examples in this article.
To start things off, let’s look at one of my all time favorite examples of useful undefined behavior, a situation involving signed integer overflow. The result of a signed integer overflow isn’t just unspecified, it’s undefined behavior. Full stop.
This goes beyond a simple matter of whether or not the underlying machine uses a two’s complement representation. From the perspective of the abstract machine, just the act a signed integer overflowing is enough to throw everything out the window, even if the overflowed result is never actually used in the program.
On the other hand, unsigned integer overflow is defined — or, more accurately, defined to wrap, not overflow. Both the undefined signed overflow and defined unsigned overflow are useful in different situations.
For example, here’s a fairly common situation, much like what actually happened in bzip2. Consider this function that does substring comparison:
int
cmp_signed(int i1, int i2, unsigned char *buf)
{
for (;;) {
int c1 = buf[i1];
int c2 = buf[i2];
if (c1 != c2)
return c1 - c2;
i1++;
i2++;
}
}
int
cmp_unsigned(unsigned i1, unsigned i2, unsigned char *buf)
{
for (;;) {
int c1 = buf[i1];
int c2 = buf[i2];
if (c1 != c2)
return c1 - c2;
i1++;
i2++;
}
}
In this function, the indices i1
and i2
will always be some small,
non-negative value. Since it’s non-negative, it should be unsigned
,
right? Not necessarily. That puts an extra constraint on code generation
and, at least on x86-64, makes for a less efficient function. Most of
the time you actually don’t want overflow to be defined, and instead
allow the compiler to assume it just doesn’t happen.
The constraint is that the behavior of i1
or i2
overflowing as an
unsigned integer is defined, and the compiler is obligated to implement
that behavior. On x86-64, where int
is 32 bits, the result of the
operation must be truncated to 32 bits one way or another, requiring
extra instructions inside the loop.
In the signed case, incrementing the integers cannot overflow since that would be undefined behavior. This permits the compiler to perform the increment only in 64-bit precision without truncation if it would be more efficient, which, in this case, it is.
Here’s the output of Clang 6.0.0 with -Os
on x86-64. Pay close
attention to the main loop, which I named .loop
:
cmp_signed:
movsxd rdi, edi ; use i1 as a 64-bit integer
mov al, [rdx + rdi]
movsxd rsi, esi ; use i2 as a 64-bit integer
mov cl, [rdx + rsi]
jmp .check
.loop: mov al, [rdx + rdi + 1]
mov cl, [rdx + rsi + 1]
inc rdx ; increment only the base pointer
.check: cmp al, cl
je .loop
movzx eax, al
movzx ecx, cl
sub eax, ecx ; return c1 - c2
ret
cmp_unsigned:
mov eax, edi
mov al, [rdx + rax]
mov ecx, esi
mov cl, [rdx + rcx]
cmp al, cl
jne .ret
inc edi
inc esi
.loop: mov eax, edi ; truncated i1 overflow
mov al, [rdx + rax]
mov ecx, esi ; truncated i2 overflow
mov cl, [rdx + rcx]
inc edi ; increment i1
inc esi ; increment i2
cmp al, cl
je .loop
.ret: movzx eax, al
movzx ecx, cl
sub eax, ecx
ret
As unsigned values, i1
and i2
can overflow independently, so they
have to be handled as independent 32-bit unsigned integers. As signed
values they can’t overflow, so they’re treated as if they were 64-bit
integers and, instead, the pointer, buf
, is incremented without
concern for overflow. The signed loop is much more efficient (5
instructions versus 8).
The signed integer helps to communicate the narrow contract of the
function — the limited range of i1
and i2
— to the compiler. In a
variant of C where signed integer overflow is defined (i.e. -fwrapv
),
this capability is lost. In fact, using -fwrapv
deoptimizes the signed
version of this function.
Side note: Using size_t
(an unsigned integer) is even better on x86-64
for this example since it’s already 64 bits and the function doesn’t
need the initial sign/zero extension. However, this might simply move
the sign extension out to the caller.
Another controversial undefined behavior is strict aliasing. This particular term doesn’t actually appear anywhere in the C specification, but it’s the popular name for C’s aliasing rules. In short, variables with types that aren’t compatible are not allowed to alias through pointers.
Here’s the classic example:
int
foo(int *a, int *b)
{
*b = 0; // store
*a = 1; // store
return *b; // load
}
Naively one might assume the return *b
could be optimized to a simple
return 0
. However, since a
and b
have the same type, the compiler
must consider the possibility that they alias — that they point to the
same place in memory — and must generate code that works correctly under
these conditions.
If foo
has a narrow contract that forbids a
and b
to alias, we
have a couple of options for helping our compiler.
First, we could manually resolve the aliasing issue by returning 0 explicitly. In more complicated functions this might mean making local copies of values, working only with those local copies, then storing the results back before returning. Then aliasing would no longer matter.
int
foo(int *a, int *b)
{
*b = 0;
*a = 1;
return 0;
}
Second, C99 introduced a restrict
qualifier to communicate to the
compiler that pointers passed to functions cannot alias. For example,
the pointers to memcpy()
are qualified with restrict
as of C99.
Passing aliasing pointers through restrict
parameters is undefined
behavior, e.g. this doesn’t ever happen as far as a compiler is
concerned.
int foo(int *restrict a, int *restrict b);
The third option is to design an interface that uses incompatible
types, exploiting strict aliasing. This happens all the time, usually
by accident. For example, int
and long
are never compatible even
when they have the same representation.
int foo(int *a, long *b);
If you use an extended or modified version of C without strict
aliasing (-fno-strict-aliasing
), then the compiler must assume
everything aliases all the time, generating a lot more precautionary
loads than necessary.
What irritates a lot of people is that compilers will still apply the strict aliasing rule even when it’s trivial for the compiler to prove that aliasing is occurring:
/* note: forbidden */
long a;
int *b = (int *)&a;
It’s not just a simple matter of making exceptions for these cases. The language specification would need to define all the rules about when and where incompatible types are permitted to alias, and developers would have to understand all these rules if they wanted to take advantage of the exceptions. It can’t just come down to trusting that the compiler is smart enough to see the aliasing when it’s sufficiently simple. It would need to be carefully defined.
Besides, there are probably conforming, portable solutions that, with contemporary compilers, will safely compile to the efficient code you actually want anyway.
There is one special exception for strict aliasing: char *
is
allowed to alias with anything. This is important to keep in mind both
when you intentionally want aliasing, but also when you want to avoid
it. Writing through a char *
pointer could force the compiler to
generate additional, unnecessary loads.
In fact, there’s a whole dimension to strict aliasing that, even today,
no compiler yet exploits: uint8_t
is not necessarily unsigned char
.
That’s just one possible typedef
definition for it. It could instead
typedef
to, say, some internal __byte
type.
In other words, technically speaking, uint8_t
does not have the strict
aliasing exemption. If you wanted to write bytes to a buffer without
worrying the compiler about aliasing issues with other pointers, this
would be the tool to accomplish it. Unfortunately there’s far too much
existing code that violates this part of strict aliasing that no
toolchain is willing to exploit it for optimization purposes.
Some kinds of undefined behavior don’t have performance or portability benefits. They’re only there to make the compiler’s job a little simpler. Today, most of these are caught trivially at compile time as syntax or semantic issues (i.e. a pointer cast to a float).
Some others are obvious about their performance benefits and don’t require much explanation. For example, it’s undefined behavior to index out of bounds (with some special exceptions for one past the end), meaning compilers are not obligated to generate those checks, instead relying on the programmer to arrange, by whatever means, that it doesn’t happen.
Undefined behavior is like nitro, a dangerous, volatile substance that makes things go really, really fast. You could argue that it’s too dangerous to use in practice, but the aggressive use of undefined behavior is not without merit.
]]>ptrace(2)
(“process trace”) system call is usually associated with
debugging. It’s the primary mechanism through which native debuggers
monitor debuggees on unix-like systems. It’s also the usual approach for
implementing strace — system call trace. With Ptrace, tracers
can pause tracees, inspect and set registers and memory, monitor
system calls, or even intercept system calls.
By intercept, I mean that the tracer can mutate system call arguments, mutate the system call return value, or even block certain system calls. Reading between the lines, this means a tracer can fully service system calls itself. This is particularly interesting because it also means a tracer can emulate an entire foreign operating system. This is done without any special help from the kernel beyond Ptrace.
The catch is that a process can only have one tracer attached at a time, so it’s not possible emulate a foreign operating system while also debugging that process with, say, GDB. The other issue is that emulated systems calls will have higher overhead.
For this article I’m going to focus on Linux’s Ptrace on x86-64, and I’ll be taking advantage of a few Linux-specific extensions. For the article I’ll also be omitting error checks, but the full source code listings will have them.
You can find runnable code for the examples in this article here:
https://github.com/skeeto/ptrace-examples
Before getting into the really interesting stuff, let’s start by reviewing a bare bones implementation of strace. It’s no DTrace, but strace is still incredibly useful.
Ptrace has never been standardized. Its interface is similar across
different operating systems, especially in its core functionality, but
it’s still subtly different from system to system. The ptrace(2)
prototype generally looks something like this, though the specific
types may be different.
long ptrace(int request, pid_t pid, void *addr, void *data);
The pid
is the tracee’s process ID. While a tracee can have only one
tracer attached at a time, a tracer can be attached to many tracees.
The request
field selects a specific Ptrace function, just like the
ioctl(2)
interface. For strace, only two are needed:
PTRACE_TRACEME
: This process is to be traced by its parent.PTRACE_SYSCALL
: Continue, but stop at the next system call
entrance or exit.PTRACE_GETREGS
: Get a copy of the tracee’s registers.The other two fields, addr
and data
, serve as generic arguments for
the selected Ptrace function. One or both are often ignored, in which
case I pass zero.
The strace interface is essentially a prefix to another command.
$ strace [strace options] program [arguments]
My minimal strace doesn’t have any options, so the first thing to do —
assuming it has at least one argument — is fork(2)
and exec(2)
the
tracee process on the tail of argv
. But before loading the target
program, the new process will inform the kernel that it’s going to be
traced by its parent. The tracee will be paused by this Ptrace system
call.
pid_t pid = fork();
switch (pid) {
case -1: /* error */
FATAL("%s", strerror(errno));
case 0: /* child */
ptrace(PTRACE_TRACEME, 0, 0, 0);
execvp(argv[1], argv + 1);
FATAL("%s", strerror(errno));
}
The parent waits for the child’s PTRACE_TRACEME
using wait(2)
. When
wait(2)
returns, the child will be paused.
waitpid(pid, 0, 0);
Before allowing the child to continue, we tell the operating system that
the tracee should be terminated along with its parent. A real strace
implementation may want to set other options, such as
PTRACE_O_TRACEFORK
.
ptrace(PTRACE_SETOPTIONS, pid, 0, PTRACE_O_EXITKILL);
All that’s left is a simple, endless loop that catches on system calls one at a time. The body of the loop has four steps:
The PTRACE_SYSCALL
request is used in both waiting for the next system
call to begin, and waiting for that system call to exit. As before, a
wait(2)
is needed to wait for the tracee to enter the desired state.
ptrace(PTRACE_SYSCALL, pid, 0, 0);
waitpid(pid, 0, 0);
When wait(2)
returns, the registers for the thread that made the
system call are filled with the system call number and its arguments.
However, the operating system has not yet serviced this system call.
This detail will be important later.
The next step is to gather the system call information. This is where
it gets architecture specific. On x86-64, the system call number is
passed in rax
, and the arguments (up to 6) are passed in
rdi
, rsi
, rdx
, r10
, r8
, and r9
. Reading the registers is
another Ptrace call, though there’s no need to wait(2)
since the
tracee isn’t changing state.
struct user_regs_struct regs;
ptrace(PTRACE_GETREGS, pid, 0, ®s);
long syscall = regs.orig_rax;
fprintf(stderr, "%ld(%ld, %ld, %ld, %ld, %ld, %ld)",
syscall,
(long)regs.rdi, (long)regs.rsi, (long)regs.rdx,
(long)regs.r10, (long)regs.r8, (long)regs.r9);
There’s one caveat. For internal kernel purposes, the system
call number is stored in orig_rax
rather than rax
. All the other
system call arguments are straightforward.
Next it’s another PTRACE_SYSCALL
and wait(2)
, then another
PTRACE_GETREGS
to fetch the result. The result is stored in rax
.
ptrace(PTRACE_GETREGS, pid, 0, ®s);
fprintf(stderr, " = %ld\n", (long)regs.rax);
The output from this simple program is very crude. There is no
symbolic name for the system call and every argument is printed
numerically, even if it’s a pointer to a buffer. A more complete strace
would know which arguments are pointers and use process_vm_readv(2)
to
read those buffers from the tracee in order to print them appropriately.
However, this does lay the groundwork for system call interception.
Suppose we want to use Ptrace to implement something like OpenBSD’s
pledge(2)
, in which a process pledges to use only a
restricted set of system calls. The idea is that many
programs typically have an initialization phase where they need lots
of system access (opening files, binding sockets, etc.). After
initialization they enter a main loop in which they processing input
and only a small set of system calls are needed.
Before entering this main loop, a process can limit itself to the few operations that it needs. If the program has a flaw allowing it to be exploited by bad input, the pledge significantly limits what the exploit can accomplish.
Using the same strace model, rather than print out all system calls,
we could either block certain system calls or simply terminate the
tracee when it misbehaves. Termination is easy: just call exit(2)
in
the tracer. Since it’s configured to also terminate the tracee.
Blocking the system call and allowing the child to continue is a
little trickier.
The tricky part is that there’s no way to abort a system call once
it’s started. When tracer returns from wait(2)
on the entrance to
the system call, the only way to stop a system call from happening is
to terminate the tracee.
However, not only can we mess with the system call arguments, we can
change the system call number itself, converting it to a system call
that doesn’t exist. On return we can report a “friendly” EPERM
error
in errno
via the normal in-band signaling.
for (;;) {
/* Enter next system call */
ptrace(PTRACE_SYSCALL, pid, 0, 0);
waitpid(pid, 0, 0);
struct user_regs_struct regs;
ptrace(PTRACE_GETREGS, pid, 0, ®s);
/* Is this system call permitted? */
int blocked = 0;
if (is_syscall_blocked(regs.orig_rax)) {
blocked = 1;
regs.orig_rax = -1; // set to invalid syscall
ptrace(PTRACE_SETREGS, pid, 0, ®s);
}
/* Run system call and stop on exit */
ptrace(PTRACE_SYSCALL, pid, 0, 0);
waitpid(pid, 0, 0);
if (blocked) {
/* errno = EPERM */
regs.rax = -EPERM; // Operation not permitted
ptrace(PTRACE_SETREGS, pid, 0, ®s);
}
}
This simple example only checks against a whitelist or blacklist of
system calls. And there’s no nuance, such as allowing files to be
opened (open(2)
) read-only but not as writable, allowing anonymous
memory maps but not non-anonymous mappings, etc. There’s also no way
to the tracee to dynamically drop privileges.
How could the tracee communicate to the tracer? Use an artificial system call!
For my new pledge-like system call — which I call xpledge()
to
distinguish it from the real thing — I picked system call number 10000,
a nice high number that’s unlikely to ever be used for a real system
call.
#define SYS_xpledge 10000
Just for demonstration purposes, I put together a minuscule interface
that’s not good for much in practice. It has little in common with
OpenBSD’s pledge(2)
, which uses a string interface.
Actually designing robust and secure sets of privileges is really
complicated, as the pledge(2)
manpage shows. Here’s the entire
interface and implementation of the system call for the tracee:
#define _GNU_SOURCE
#include <unistd.h>
#define XPLEDGE_RDWR (1 << 0)
#define XPLEDGE_OPEN (1 << 1)
#define xpledge(arg) syscall(SYS_xpledge, arg)
If it passes zero for the argument, only a few basic system calls are
allowed, including those used to allocate memory (e.g. brk(2)
). The
PLEDGE_RDWR
bit allows various read and write system calls
(read(2)
, readv(2)
, pread(2)
, preadv(2)
, etc.). The
PLEDGE_OPEN
bit allows open(2)
.
To prevent privileges from being escalated back, pledge()
blocks
itself — though this also prevents dropping more privileges later down
the line.
In the xpledge tracer, I just need to check for this system call:
/* Handle entrance */
switch (regs.orig_rax) {
case SYS_pledge:
register_pledge(regs.rdi);
break;
}
The operating system will return ENOSYS
(Function not implemented)
since this isn’t a real system call. So on the way out I overwrite
this with a success (0).
/* Handle exit */
switch (regs.orig_rax) {
case SYS_pledge:
ptrace(PTRACE_POKEUSER, pid, RAX * 8, 0);
break;
}
I wrote a little test program that opens /dev/urandom
, makes a read,
tries to pledge, then tries to open /dev/urandom
a second time, then
confirms it can read from the original /dev/urandom
file descriptor.
Running without a pledge tracer, the output looks like this:
$ ./example
fread("/dev/urandom")[1] = 0xcd2508c7
XPledging...
XPledge failed: Function not implemented
fread("/dev/urandom")[2] = 0x0be4a986
fread("/dev/urandom")[1] = 0x03147604
Making an invalid system call doesn’t crash an application. It just fails, which is a rather convenient fallback. When run under the tracer, it looks like this:
$ ./xpledge ./example
fread("/dev/urandom")[1] = 0xb2ac39c4
XPledging...
fopen("/dev/urandom")[2]: Operation not permitted
fread("/dev/urandom")[1] = 0x2e1bd1c4
The pledge succeeds but the second fopen(3)
does not since the tracer
blocked it with EPERM
.
This concept could be taken much further, to, say, change file paths or return fake results. A tracer could effectively chroot its tracee, prepending some chroot path to the root of any path passed through a system call. It could even lie to the process about what user it is, claiming that it’s running as root. In fact, this is exactly how the Fakeroot NG program works.
Suppose you don’t just want to intercept some system calls, but all system calls. You’ve got a binary intended to run on another operating system, so none of the system calls it makes will ever work.
You could manage all this using only what I’ve described so far. The tracer would always replace the system call number with a dummy, allow it to fail, then service the system call itself. But that’s really inefficient. That’s essentially three context switches for each system call: one to stop on the entrance, one to make the always-failing system call, and one to stop on the exit.
The Linux version of PTrace has had a more efficient operation for
this technique since 2005: PTRACE_SYSEMU
. PTrace stops only once
per a system call, and it’s up to the tracer to service that system
call before allowing the tracee to continue.
for (;;) {
ptrace(PTRACE_SYSEMU, pid, 0, 0);
waitpid(pid, 0, 0);
struct user_regs_struct regs;
ptrace(PTRACE_GETREGS, pid, 0, ®s);
switch (regs.orig_rax) {
case OS_read:
/* ... */
case OS_write:
/* ... */
case OS_open:
/* ... */
case OS_exit:
/* ... */
/* ... and so on ... */
}
}
To run binaries for the same architecture from any system with a
stable (enough) system call ABI, you just need this PTRACE_SYSEMU
tracer, a loader (to take the place of exec(2)
), and whatever system
libraries the binary needs (or only run static binaries).
In fact, this sounds like a fun weekend project.
Over on GitHub, David Yu has an interesting performance benchmark for function calls of various Foreign Function Interfaces (FFI):
https://github.com/dyu/ffi-overhead
He created a shared object (.so
) file containing a single, simple C
function. Then for each FFI he wrote a bit of code to call this function
many times, measuring how long it took.
For the C “FFI” he used standard dynamic linking, not dlopen()
. This
distinction is important, since it really makes a difference in the
benchmark. There’s a potential argument about whether or not this is a
fair comparison to an actual FFI, but, regardless, it’s still
interesting to measure.
The most surprising result of the benchmark is that LuaJIT’s FFI is substantially faster than C. It’s about 25% faster than a native C function call to a shared object function. How could a weakly and dynamically typed scripting language come out ahead on a benchmark? Is this accurate?
It’s actually quite reasonable. The benchmark was run on Linux, so the performance penalty we’re seeing comes the Procedure Linkage Table (PLT). I’ve put together a really simple experiment to demonstrate the same effect in plain old C:
https://github.com/skeeto/dynamic-function-benchmark
Here are the results on an Intel i7-6700 (Skylake):
plt: 1.759799 ns/call
ind: 1.257125 ns/call
jit: 1.008108 ns/call
These are three different types of function calls:
dlsym(3)
)As shown, the last one is the fastest. It’s typically not an option for C programs, but it’s natural in the presence of a JIT compiler, including, apparently, LuaJIT.
In my benchmark, the function being called is named empty()
:
void empty(void) { }
And to compile it into a shared object:
$ cc -shared -fPIC -Os -o empty.so empty.c
Just as in my PRNG shootout, the benchmark calls this function repeatedly as many times as possible before an alarm goes off.
When a program or library calls a function in another shared object, the compiler cannot know where that function will be located in memory. That information isn’t known until run time, after the program and its dependencies are loaded into memory. These are usually at randomized locations — e.g. Address Space Layout Randomization (ASLR).
How is this resolved? Well, there are a couple of options.
One option is to make a note about each such call in the binary’s metadata. The run-time dynamic linker can then patch in the correct address at each call site. How exactly this would work depends on the particular code model used when compiling the binary.
The downside to this approach is slower loading, larger binaries, and less sharing of code pages between different processes. It’s slower loading because every dynamic call site needs to be patched before the program can begin execution. The binary is larger because each of these call sites needs an entry in the relocation table. And the lack of sharing is due to the code pages being modified.
On the other hand, the overhead for dynamic function calls would be eliminated, giving JIT-like performance as seen in the benchmark.
The second option is to route all dynamic calls through a table. The original call site calls into a stub in this table, which jumps to the actual dynamic function. With this approach the code does not need to be patched, meaning it’s trivially shared between processes. Only one place needs to be patched per dynamic function: the entries in the table. Even more, these patches can be performed lazily, on the first function call, making the load time even faster.
On systems using ELF binaries, this table is called the Procedure Linkage Table (PLT). The PLT itself doesn’t actually get patched — it’s mapped read-only along with the rest of the code. Instead the Global Offset Table (GOT) gets patched. The PLT stub fetches the dynamic function address from the GOT and indirectly jumps to that address. To lazily load function addresses, these GOT entries are initialized with an address of a function that locates the target symbol, updates the GOT with that address, and then jumps to that function. Subsequent calls use the lazily discovered address.
The downside of a PLT is extra overhead per dynamic function call, which is what shows up in the benchmark. Since the benchmark only measures function calls, this appears to be pretty significant, but in practice it’s usually drowned out in noise.
Here’s the benchmark:
/* Cleared by an alarm signal. */
volatile sig_atomic_t running;
static long
plt_benchmark(void)
{
long count;
for (count = 0; running; count++)
empty();
return count;
}
Since empty()
is in the shared object, that call goes through the PLT.
Another way to dynamically call functions is to bypass the PLT and
fetch the target function address within the program, e.g. via
dlsym(3)
.
void *h = dlopen("path/to/lib.so", RTLD_NOW);
void (*f)(void) = dlsym("f");
f();
Once the function address is obtained, the overhead is smaller than
function calls routed through the PLT. There’s no intermediate stub
function and no GOT access. (Caveat: If the program has a PLT entry for
the given function then dlsym(3)
may actually return the address of
the PLT stub.)
However, this is still an indirect function call. On conventional architectures, direct function calls have an immediate relative address. That is, the target of the call is some hard-coded offset from the call site. The CPU can see well ahead of time where the call is going.
An indirect function call has more overhead. First, the address has to be stored somewhere. Even if that somewhere is just a register, it increases register pressure by using up a register. Second, it provokes the CPU’s branch predictor since the call target isn’t static, making for extra bookkeeping in the CPU. In the worst case the function call may even cause a pipeline stall.
Here’s the benchmark:
volatile sig_atomic_t running;
static long
indirect_benchmark(void (*f)(void))
{
long count;
for (count = 0; running; count++)
f();
return count;
}
The function passed to this benchmark is fetched with dlsym(3)
so the
compiler can’t do something tricky like convert that indirect
call back into a direct call.
If the body of the loop was complicated enough that there was register pressure, thereby requiring the address to be spilled onto the stack, this benchmark might not fare as well against the PLT benchmark.
The first two types of dynamic function calls are simple and easy to use. Direct calls to dynamic functions is trickier business since it requires modifying code at run time. In my benchmark I put together a little JIT compiler to generate the direct call.
There’s a gotcha to this: on x86-64 direct jumps are limited to a 2GB
range due to a signed 32-bit immediate. This means the JIT code has to
be placed virtually nearby the target function, empty()
. If the JIT
code needed to call two different dynamic functions separated by more
than 2GB, then it’s not possible for both to be direct.
To keep things simple, my benchmark isn’t precise or very careful
about picking the JIT code address. After being given the target
function address, it blindly subtracts 4MB, rounds down to the nearest
page, allocates some memory, and writes code into it. To do this
correctly would mean inspecting the program’s own memory mappings to
find space, and there’s no clean, portable way to do this. On Linux
this requires parsing virtual files under /proc
.
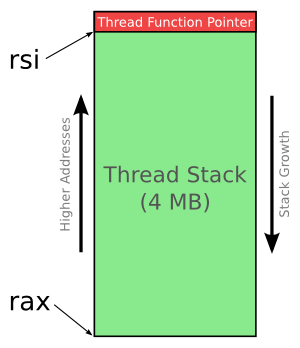
Here’s what my JIT’s memory allocation looks like. It assumes
reasonable behavior for uintptr_t
casts:
static void
jit_compile(struct jit_func *f, void (*empty)(void))
{
uintptr_t addr = (uintptr_t)empty;
void *desired = (void *)((addr - SAFETY_MARGIN) & PAGEMASK);
/* ... */
unsigned char *p = mmap(desired, len, prot, flags, fd, 0);
/* ... */
}
It allocates two pages, one writable and the other containing
non-writable code. Similar to my closure library, the lower
page is writable and holds the running
variable that gets cleared by
the alarm. It needed to be nearby the JIT code in order to be an
efficient RIP-relative access, just like the other two benchmark
functions. The upper page contains this assembly:
jit_benchmark:
push rbx
xor ebx, ebx
.loop: mov eax, [rel running]
test eax, eax
je .done
call empty
inc ebx
jmp .loop
.done: mov eax, ebx
pop rbx
ret
The call empty
is the only instruction that is dynamically generated
— necessary to fill out the relative address appropriately (the minus
5 is because it’s relative to the end of the instruction):
// call empty
uintptr_t rel = (uintptr_t)empty - (uintptr_t)p - 5;
*p++ = 0xe8;
*p++ = rel >> 0;
*p++ = rel >> 8;
*p++ = rel >> 16;
*p++ = rel >> 24;
If empty()
wasn’t in a shared object and instead located in the same
binary, this is essentially the direct call that the compiler would have
generated for plt_benchmark()
, assuming somehow it didn’t inline
empty()
.
Ironically, calling the JIT-compiled code requires an indirect call (e.g. via a function pointer), and there’s no way around this. What are you going to do, JIT compile another function that makes the direct call? Fortunately this doesn’t matter since the part being measured in the loop is only a direct call.
Given these results, it’s really no mystery that LuaJIT can generate more efficient dynamic function calls than a PLT, even if they still end up being indirect calls. In my benchmark, the non-PLT indirect calls were 28% faster than the PLT, and the direct calls 43% faster than the PLT. That’s a small edge that JIT-enabled programs have over plain old native programs, though it comes at the cost of absolutely no code sharing between processes.
]]>So far this year I’ve been bitten three times by compiler edge cases in GCC and Clang, each time catching me totally by surprise. Two were caused by historical artifacts, where an ambiguous specification lead to diverging implementations. The third was a compiler optimization being far more clever than I expected, behaving almost like an artificial intelligence.
In all examples I’ll be using GCC 7.3.0 and Clang 6.0.0 on Linux.
The first time I was bit — or, well, narrowly avoided being bit — was when I examined a missed floating point optimization in both Clang and GCC. Consider this function:
double
zero_multiply(double x)
{
return x * 0.0;
}
The function multiplies its argument by zero and returns the result. Any number multiplied by zero is zero, so this should always return zero, right? Unfortunately, no. IEEE 754 floating point arithmetic supports NaN, infinities, and signed zeros. This function can return NaN, positive zero, or negative zero. (In some cases, the operation could also potentially produce a hardware exception.)
As a result, both GCC and Clang perform the multiply:
zero_multiply:
xorpd xmm1, xmm1
mulsd xmm0, xmm1
ret
The -ffast-math
option relaxes the C standard floating point rules,
permitting an optimization at the cost of conformance and
consistency:
zero_multiply:
xorps xmm0, xmm0
ret
Side note: -ffast-math
doesn’t necessarily mean “less precise.”
Sometimes it will actually improve precision.
Here’s a modified version of the function that’s a little more
interesting. I’ve changed the argument to a short
:
double
zero_multiply_short(short x)
{
return x * 0.0;
}
It’s no longer possible for the argument to be one of those special
values. The short
will be promoted to one of 65,535 possible double
values, each of which results in 0.0 when multiplied by 0.0. GCC misses
this optimization (-Os
):
zero_multiply_short:
movsx edi, di ; sign-extend 16-bit argument
xorps xmm1, xmm1 ; xmm1 = 0.0
cvtsi2sd xmm0, edi ; convert int to double
mulsd xmm0, xmm1
ret
Clang also misses this optimization:
zero_multiply_short:
cvtsi2sd xmm1, edi
xorpd xmm0, xmm0
mulsd xmm0, xmm1
ret
But hang on a minute. This is shorter by one instruction. What
happened to the sign-extension (movsx
)? Clang is treating that
short
argument as if it were a 32-bit value. Why do GCC and Clang
differ? Is GCC doing something unnecessary?
It turns out that the x86-64 ABI didn’t specify what happens with the upper bits in argument registers. Are they garbage? Are they zeroed? GCC takes the conservative position of assuming the upper bits are arbitrary garbage. Clang takes the boldest position of assuming arguments smaller than 32 bits have been promoted to 32 bits by the caller. This is what the ABI specification should have said, but currently it does not.
Fortunately GCC also conservative when passing arguments. It promotes arguments to 32 bits as necessary, so there are no conflicts when linking against Clang-compiled code. However, this is not true for Intel’s ICC compiler: Clang and ICC are not ABI-compatible on x86-64.
I don’t use ICC, so that particular issue wouldn’t bite me, but if I was ever writing assembly routines that called Clang-compiled code, I’d eventually get bit by this.
Without looking it up or trying it, what does this function return? Think carefully.
int
float_compare(void)
{
float x = 1.3f;
return x == 1.3f;
}
Confident in your answer? This is a trick question, because it can return either 0 or 1 depending on the compiler. Boy was I confused when this comparison returned 0 in my real world code.
$ gcc -std=c99 -m32 cmp.c # float_compare() == 0
$ clang -std=c99 -m32 cmp.c # float_compare() == 1
So what’s going on here? The original ANSI C specification wasn’t
clear about how intermediate floating point values get rounded, and
implementations all did it differently. The C99 specification
cleaned this all up and introduced FLT_EVAL_METHOD
.
Implementations can still differ, but at least you can now determine
at compile-time what the compiler would do by inspecting that macro.
Back in the late 1980’s or early 1990’s when the GCC developers were
deciding how GCC should implement floating point arithmetic, the trend
at the time was to use as much precision as possible. On the x86 this
meant using its support for 80-bit extended precision floating point
arithmetic. Floating point operations are performed in long double
precision and truncated afterward (FLT_EVAL_METHOD == 2
).
In float_compare()
the left-hand side is truncated to a float
by the
assignment, but the right-hand side, despite being a float
literal,
is actually “1.3” at 80 bits of precision as far as GCC is concerned.
That’s pretty unintuitive!
The remnants of this high precision trend are still in JavaScript, where all arithmetic is double precision (even if simulated using integers), and great pains have been made to work around the performance consequences of this. Until recently, Mono had similar issues.
The trend reversed once SIMD hardware became widely available and
there were huge performance gains to be had. Multiple values could be
computed at once, side by side, at lower precision. So on x86-64, this
became the default (FLT_EVAL_METHOD == 0
). The young Clang compiler
wasn’t around until well after this trend reversed, so it behaves
differently than the backwards compatible GCC on the old x86.
I’m a little ashamed that I’m only finding out about this now. However, by the time I was competent enough to notice and understand this issue, I was already doing nearly all my programming on the x86-64.
I’ve saved this one for last since it’s my favorite. Suppose we have
this little function, new_image()
, that allocates a greyscale image
for, say, some multimedia library.
static unsigned char *
new_image(size_t w, size_t h, int shade)
{
unsigned char *p = 0;
if (w == 0 || h <= SIZE_MAX / w) { // overflow?
p = malloc(w * h);
if (p) {
memset(p, shade, w * h);
}
}
return p;
}
It’s a static function because this would be part of some slick header library (and, secretly, because it’s necessary for illustrating the issue). Being a responsible citizen, the function even checks for integer overflow before allocating anything.
I write a unit test to make sure it detects overflow. This function should return 0.
/* expected return == 0 */
int
test_new_image_overflow(void)
{
void *p = new_image(2, SIZE_MAX, 0);
return !!p;
}
So far my test passes. Good.
I’d also like to make sure it correctly returns NULL — or, more
specifically, that it doesn’t crash — if the allocation fails. But how
can I make malloc()
fail? As a hack I can pass image dimensions that
I know cannot ever practically be allocated. Essentially I want to
force a malloc(SIZE_MAX)
, e.g. allocate every available byte in my
virtual address space. For a conventional 64-bit machine, that’s 16
exibytes of memory, and it leaves space for nothing else, including
the program itself.
/* expected return == 0 */
int
test_new_image_oom(void)
{
void *p = new_image(1, SIZE_MAX, 0xff);
return !!p;
}
I compile with GCC, test passes. I compile with Clang and the test fails. That is, the test somehow managed to allocate 16 exibytes of memory, and initialize it. Wat?
Disassembling the test reveals what’s going on:
test_new_image_overflow:
xor eax, eax
ret
test_new_image_oom:
mov eax, 1
ret
The first test is actually being evaluated at compile time by the
compiler. The function being tested was inlined into the unit test
itself. This permits the compiler to collapse the whole thing down to
a single instruction. The path with malloc()
became dead code and
was trivially eliminated.
In the second test, Clang correctly determined that the image buffer is
not actually being used, despite the memset()
, so it eliminated the
allocation altogether and then simulated a successful allocation
despite it being absurdly large. Allocating memory is not an observable
side effect as far as the language specification is concerned, so it’s
allowed to do this. My thinking was wrong, and the compiler outsmarted
me.
I soon realized I can take this further and trick Clang into
performing an invalid optimization, revealing a bug. Consider
this slightly-optimized version that uses calloc()
when the shade is
zero (black). The calloc()
function does its own overflow check, so
new_image()
doesn’t need to do it.
static void *
new_image(size_t w, size_t h, int shade)
{
unsigned char *p = 0;
if (shade == 0) { // shortcut
p = calloc(w, h);
} else if (w == 0 || h <= SIZE_MAX / w) { // overflow?
p = malloc(w * h);
if (p) {
memset(p, color, w * h);
}
}
return p;
}
With this change, my overflow unit test is now also failing. The
situation is even worse than before. The calloc()
is being
eliminated despite the overflow, and replaced with a simulated
success. This time it’s actually a bug in Clang. While failing a unit
test is mostly harmless, this could introduce a vulnerability in a
real program. The OpenBSD folks are so worried about this sort of
thing that they’ve disabled this optimization.
Here’s a slightly-contrived example of this. Imagine a program that maintains a table of unsigned integers, and we want to keep track of how many times the program has accessed each table entry. The “access counter” table is initialized to zero, but the table of values need not be initialized, since they’ll be written before first access (or something like that).
struct table {
unsigned *counter;
unsigned *values;
};
static int
table_init(struct table *t, size_t n)
{
t->counter = calloc(n, sizeof(*t->counter));
if (t->counter) {
/* Overflow already tested above */
t->values = malloc(n * sizeof(*t->values));
if (!t->values) {
free(t->counter);
return 0; // fail
}
return 1; // success
}
return 0; // fail
}
This function relies on the overflow test in calloc()
for the second
malloc()
allocation. However, this is a static function that’s
likely to get inlined, as we saw before. If the program doesn’t
actually make use of the counter
table, and Clang is able to
statically determine this fact, it may eliminate the calloc()
. This
would also eliminate the overflow test, introducing a
vulnerability. If an attacker can control n
, then they can
overwrite arbitrary memory through that values
pointer.
Besides this surprising little bug, the main lesson for me is that I should probably isolate unit tests from the code being tested. The easiest solution is to put them in separate translation units and don’t use link-time optimization (LTO). Allowing tested functions to be inlined into the unit tests is probably a bad idea.
The unit test issues in my real program, which was a bit more sophisticated than what was presented here, gave me artificial intelligence vibes. It’s that situation where a computer algorithm did something really clever and I felt it outsmarted me. It’s creepy to consider how far that can go. I’ve gotten that even from observing AI I’ve written myself, and I know for sure no human taught it some particularly clever trick.
My favorite AI story along these lines is about an AI that learned how to play games on the Nintendo Entertainment System. It didn’t understand the games it was playing. It’s optimization task was simply to choose controller inputs that maximized memory values, because that’s generally associated with doing well — higher scores, more progress, etc. The most unexpected part came when playing Tetris. Eventually the screen would fill up with blocks, and the AI would face the inevitable situation of losing the game, with all that memory being reinitialized to low values. So what did it do?
Just before the end it would pause the game and wait… forever.
]]>if
statements, loops, short-circuit operators, or other
sorts of conditional jumps. You can find the source code here along
with a test suite and benchmark:
In addition to decoding the next code point, it detects any errors and returns a pointer to the next code point. It’s the complete package.
Why branchless? Because high performance CPUs are pipelined. That is, a single instruction is executed over a series of stages, and many instructions are executed in overlapping time intervals, each at a different stage.
The usual analogy is laundry. You can have more than one load of laundry in process at a time because laundry is typically a pipelined process. There’s a washing machine stage, dryer stage, and folding stage. One load can be in the washer, a second in the drier, and a third being folded, all at once. This greatly increases throughput because, under ideal circumstances with a full pipeline, an instruction is completed each clock cycle despite any individual instruction taking many clock cycles to complete.
Branches are the enemy of pipelines. The CPU can’t begin work on the next instruction if it doesn’t know which instruction will be executed next. It must finish computing the branch condition before it can know. To deal with this, pipelined CPUs are also equipped with branch predictors. It makes a guess at which branch will be taken and begins executing instructions on that branch. The prediction is initially made using static heuristics, and later those predictions are improved by learning from previous behavior. This even includes predicting the number of iterations of a loop so that the final iteration isn’t mispredicted.
A mispredicted branch has two dire consequences. First, all the progress on the incorrect branch will need to be discarded. Second, the pipeline will be flushed, and the CPU will be inefficient until the pipeline fills back up with instructions on the correct branch. With a sufficiently deep pipeline, it can easily be more efficient to compute and discard an unneeded result than to avoid computing it in the first place. Eliminating branches means eliminating the hazards of misprediction.
Another hazard for pipelines is dependencies. If an instruction depends on the result of a previous instruction, it may have to wait for the previous instruction to make sufficient progress before it can complete one of its stages. This is known as a pipeline stall, and it is an important consideration in instruction set architecture (ISA) design.
For example, on the x86-64 architecture, storing a 32-bit result in a 64-bit register will automatically clear the upper 32 bits of that register. Any further use of that destination register cannot depend on prior instructions since all bits have been set. This particular optimization was missed in the design of the i386: Writing a 16-bit result to 32-bit register leaves the upper 16 bits intact, creating false dependencies.
Dependency hazards are mitigated using out-of-order execution. Rather than execute two dependent instructions back to back, which would result in a stall, the CPU may instead executing an independent instruction further away in between. A good compiler will also try to spread out dependent instructions in its own instruction scheduling.
The effects of out-of-order execution are typically not visible to a single thread, where everything will appear to have executed in order. However, when multiple processes or threads can access the same memory out-of-order execution can be observed. It’s one of the many challenges of writing multi-threaded software.
The focus of my UTF-8 decoder was to be branchless, but there was one interesting dependency hazard that neither GCC nor Clang were able to resolve themselves. More on that later.
Without getting into the history of it, you can generally think of UTF-8 as a method for encoding a series of 21-bit integers (code points) into a stream of bytes.
Shorter integers encode to fewer bytes than larger integers. The shortest available encoding must be chosen, meaning there is one canonical encoding for a given sequence of code points.
Certain code points are off limits: surrogate halves. These are
code points U+D800
through U+DFFF
. Surrogates are used in UTF-16
to represent code points above U+FFFF and serve no purpose in UTF-8.
This has interesting consequences for pseudo-Unicode
strings, such “wide” strings in the Win32 API, where surrogates may
appear unpaired. Such sequences cannot legally be represented in
UTF-8.
Keeping in mind these two rules, the entire format is summarized by this table:
length byte[0] byte[1] byte[2] byte[3]
1 0xxxxxxx
2 110xxxxx 10xxxxxx
3 1110xxxx 10xxxxxx 10xxxxxx
4 11110xxx 10xxxxxx 10xxxxxx 10xxxxxx
The x
placeholders are the bits of the encoded code point.
UTF-8 has some really useful properties:
It’s backwards compatible with ASCII, which never used the highest bit.
Sort order is preserved. Sorting a set of code point sequences has the same result as sorting their UTF-8 encoding.
No additional zero bytes are introduced. In C we can continue using
null terminated char
buffers, often without even realizing they
hold UTF-8 data.
It’s self-synchronizing. A leading byte will never be mistaken for a
continuation byte. This allows for byte-wise substring searches,
meaning UTF-8 unaware functions like strstr(3)
continue to work
without modification (except for normalization issues). It also
allows for unambiguous recovery of a damaged stream.
A straightforward approach to decoding might look something like this:
unsigned char *
utf8_simple(unsigned char *s, long *c)
{
unsigned char *next;
if (s[0] < 0x80) {
*c = s[0];
next = s + 1;
} else if ((s[0] & 0xe0) == 0xc0) {
*c = ((long)(s[0] & 0x1f) << 6) |
((long)(s[1] & 0x3f) << 0);
next = s + 2;
} else if ((s[0] & 0xf0) == 0xe0) {
*c = ((long)(s[0] & 0x0f) << 12) |
((long)(s[1] & 0x3f) << 6) |
((long)(s[2] & 0x3f) << 0);
next = s + 3;
} else if ((s[0] & 0xf8) == 0xf0 && (s[0] <= 0xf4)) {
*c = ((long)(s[0] & 0x07) << 18) |
((long)(s[1] & 0x3f) << 12) |
((long)(s[2] & 0x3f) << 6) |
((long)(s[3] & 0x3f) << 0);
next = s + 4;
} else {
*c = -1; // invalid
next = s + 1; // skip this byte
}
if (*c >= 0xd800 && *c <= 0xdfff)
*c = -1; // surrogate half
return next;
}
It branches off on the highest bits of the leading byte, extracts all of
those x
bits from each byte, concatenates those bits, checks if it’s a
surrogate half, and returns a pointer to the next character. (This
implementation does not check that the highest two bits of each
continuation byte are correct.)
The CPU must correctly predict the length of the code point or else it will suffer a hazard. An incorrect guess will stall the pipeline and slow down decoding.
In real world text this is probably not a serious issue. For the English language, the encoded length is nearly always a single byte. However, even for non-English languages, text is usually accompanied by markup from the ASCII range of characters, and, overall, the encoded lengths will still have consistency. As I said, the CPU predicts branches based on the program’s previous behavior, so this means it will temporarily learn some of the statistical properties of the language being actively decoded. Pretty cool, eh?
Eliminating branches from the decoder side-steps any issues with mispredicting encoded lengths. Only errors in the stream will cause stalls. Since that’s probably the unusual case, the branch predictor will be very successful by continually predicting success. That’s one optimistic CPU.
Here’s the interface to my branchless decoder:
void *utf8_decode(void *buf, uint32_t *c, int *e);
I chose void *
for the buffer so that it doesn’t care what type was
actually chosen to represent the buffer. It could be a uint8_t
,
char
, unsigned char
, etc. Doesn’t matter. The encoder accesses it
only as bytes.
On the other hand, with this interface you’re forced to use uint32_t
to represent code points. You could always change the function to suit
your own needs, though.
Errors are returned in e
. It’s zero for success and non-zero when an
error was detected, without any particular meaning for different values.
Error conditions are mixed into this integer, so a zero simply means the
absence of error.
This is where you could accuse me of “cheating” a little bit. The
caller probably wants to check for errors, and so they will have to
branch on e
. It seems I’ve just smuggled the branches outside of the
decoder.
However, as I pointed out, unless you’re expecting lots of errors, the
real cost is branching on encoded lengths. Furthermore, the caller
could instead accumulate the errors: count them, or make the error
“sticky” by ORing all e
values together. Neither of these require a
branch. The caller could decode a huge stream and only check for
errors at the very end. The only branch would be the main loop (“are
we done yet?”), which is trivial to predict with high accuracy.
The first thing the function does is extract the encoded length of the next code point:
static const char lengths[] = {
1, 1, 1, 1, 1, 1, 1, 1, 1, 1, 1, 1, 1, 1, 1, 1,
0, 0, 0, 0, 0, 0, 0, 0, 2, 2, 2, 2, 3, 3, 4, 0
};
unsigned char *s = buf;
int len = lengths[s[0] >> 3];
Looking back to the UTF-8 table above, only the highest 5 bits determine
the length. That’s 32 possible values. The zeros are for invalid
prefixes. This will later cause a bit to be set in e
.
With the length in hand, it can compute the position of the next code point in the buffer.
unsigned char *next = s + len + !len;
Originally this expression was the return value, computed at the very end of the function. However, after inspecting the compiler’s assembly output, I decided to move it up, and the result was a solid performance boost. That’s because it spreads out dependent instructions. With the address of the next code point known so early, the instructions that decode the next code point can get started early.
The reason for the !len
is so that the pointer is advanced one byte
even in the face of an error (length of zero). Adding that !len
is
actually somewhat costly, though I couldn’t figure out why.
static const int shiftc[] = {0, 18, 12, 6, 0};
*c = (uint32_t)(s[0] & masks[len]) << 18;
*c |= (uint32_t)(s[1] & 0x3f) << 12;
*c |= (uint32_t)(s[2] & 0x3f) << 6;
*c |= (uint32_t)(s[3] & 0x3f) << 0;
*c >>= shiftc[len];
This reads four bytes regardless of the actual length. Avoiding doing something is branching, so this can’t be helped. The unneeded bits are shifted out based on the length. That’s all it takes to decode UTF-8 without branching.
One important consequence of always reading four bytes is that the caller must zero-pad the buffer to at least four bytes. In practice, this means padding the entire buffer with three bytes in case the last character is a single byte.
The padding must be zero in order to detect errors. Otherwise the padding might look like legal continuation bytes.
static const uint32_t mins[] = {4194304, 0, 128, 2048, 65536};
static const int shifte[] = {0, 6, 4, 2, 0};
*e = (*c < mins[len]) << 6;
*e |= ((*c >> 11) == 0x1b) << 7; // surrogate half?
*e |= (s[1] & 0xc0) >> 2;
*e |= (s[2] & 0xc0) >> 4;
*e |= (s[3] ) >> 6;
*e ^= 0x2a;
*e >>= shifte[len];
The first line checks if the shortest encoding was used, setting a bit
in e
if it wasn’t. For a length of 0, this always fails.
The second line checks for a surrogate half by checking for a certain prefix.
The next three lines accumulate the highest two bits of each
continuation byte into e
. Each should be the bits 10
. These bits are
“compared” to 101010
(0x2a
) using XOR. The XOR clears these bits as
long as they exactly match.
Finally the continuation prefix bits that don’t matter are shifted out.
My primary — and totally arbitrary — goal was to beat the performance of
Björn Höhrmann’s DFA-based decoder. Under favorable (and
artificial) benchmark conditions I had moderate success. You can try it
out on your own system by cloning the repository and running make
bench
.
With GCC 6.3.0 on an i7-6700, my decoder is about 20% faster than the DFA decoder in the benchmark. With Clang 3.8.1 it’s just 1% faster.
Update: Björn pointed out that his site includes a faster variant of his DFA decoder. It is only 10% slower than the branchless decoder with GCC, and it’s 20% faster than the branchless decoder with Clang. So, in a sense, it’s still faster on average, even on a benchmark that favors a branchless decoder.
The benchmark operates very similarly to my PRNG shootout (e.g.
alarm(2)
). First a buffer is filled with random UTF-8 data, then the
decoder decodes it again and again until the alarm fires. The
measurement is the number of bytes decoded.
The number of errors is printed at the end (always 0) in order to force errors to actually get checked for each code point. Otherwise the sneaky compiler omits the error checking from the branchless decoder, making it appear much faster than it really is — a serious letdown once I noticed my error. Since the other decoder is a DFA and error checking is built into its graph, the compiler can’t really omit its error checking.
I called this “favorable” because the buffer being decoded isn’t anything natural. Each time a code point is generated, first a length is chosen uniformly: 1, 2, 3, or 4. Then a code point that encodes to that length is generated. The even distribution of lengths greatly favors a branchless decoder. The random distribution inhibits branch prediction. Real text has a far more favorable distribution.
uint32_t
randchar(uint64_t *s)
{
uint32_t r = rand32(s);
int len = 1 + (r & 0x3);
r >>= 2;
switch (len) {
case 1:
return r % 128;
case 2:
return 128 + r % (2048 - 128);
case 3:
return 2048 + r % (65536 - 2048);
case 4:
return 65536 + r % (131072 - 65536);
}
abort();
}
Given the odd input zero-padding requirement and the artificial parameters of the benchmark, despite the supposed 20% speed boost under GCC, my branchless decoder is not really any better than the DFA decoder in practice. It’s just a different approach. In practice I’d prefer Björn’s DFA decoder.
Update: Bryan Donlan has followed up with a SIMD UTF-8 decoder.
Update 2024: NRK has followed up with parallel extract decoder.
]]>I use pseudo-random number generators (PRNGs) a whole lot. They’re an essential component in lots of algorithms and processes.
Monte Carlo simulations, where PRNGs are used to compute numeric estimates for problems that are difficult or impossible to solve analytically.
Monte Carlo tree search AI, where massive numbers of games are played out randomly in search of an optimal move. This is a specific application of the last item.
Genetic algorithms, where a PRNG creates the initial population, and then later guides in mutation and breeding of selected solutions.
Cryptography, where a cryptographically-secure PRNGs (CSPRNGs) produce output that is predictable for recipients who know a particular secret, but not for anyone else. This article is only concerned with plain PRNGs.
For the first three “simulation” uses, there are two primary factors that drive the selection of a PRNG. These factors can be at odds with each other:
The PRNG should be very fast. The application should spend its time running the actual algorithms, not generating random numbers.
PRNG output should have robust statistical qualities. Bits should appear to be independent and the output should closely follow the desired distribution. Poor quality output will negatively effect the algorithms using it. Also just as important is how you use it, but this article will focus only on generating bits.
In other situations, such as in cryptography or online gambling, another important property is that an observer can’t learn anything meaningful about the PRNG’s internal state from its output. For the three simulation cases I care about, this is not a concern. Only speed and quality properties matter.
Depending on the programming language, the PRNGs found in various
standard libraries may be of dubious quality. They’re slower than they
need to be, or have poorer quality than required. In some cases, such
as rand()
in C, the algorithm isn’t specified, and you can’t rely on
it for anything outside of trivial examples. In other cases the
algorithm and behavior is specified, but you could easily do better
yourself.
My preference is to BYOPRNG: Bring Your Own Pseudo-random Number Generator. You get reliable, identical output everywhere. Also, in the case of C and C++ — and if you do it right — by embedding the PRNG in your project, it will get inlined and unrolled, making it far more efficient than a slow call into a dynamic library.
A fast PRNG is going to be small, making it a great candidate for embedding as, say, a header library. That leaves just one important question, “Can the PRNG be small and have high quality output?” In the 21st century, the answer to this question is an emphatic “yes!”
For the past few years my main go to for a drop-in PRNG has been xorshift*. The body of the function is 6 lines of C, and its entire state is a 64-bit integer, directly seeded. However, there are a number of choices here, including other variants of Xorshift. How do I know which one is best? The only way to know is to test it, hence my 64-bit PRNG shootout:
Sure, there are other such shootouts, but they’re all missing something I want to measure. I also want to test in an environment very close to how I’d use these PRNGs myself.
Before getting into the details of the benchmark and each generator, here are the results. These tests were run on an i7-6700 (Skylake) running Linux 4.9.0.
Speed (MB/s)
PRNG FAIL WEAK gcc-6.3.0 clang-3.8.1
------------------------------------------------
baseline X X 15000 13100
blowfishcbc16 0 1 169 157
blowfishcbc4 0 5 725 676
blowfishctr16 1 3 187 184
blowfishctr4 1 5 890 1000
mt64 1 7 1700 1970
pcg64 0 4 4150 3290
rc4 0 5 366 185
spcg64 0 8 5140 4960
xoroshiro128+ 0 6 8100 7720
xorshift128+ 0 2 7660 6530
xorshift64* 0 3 4990 5060
And the actual dieharder outputs:
The clear winner is xoroshiro128+, with a function body of just 7 lines of C. It’s clearly the fastest, and the output had no observed statistical failures. However, that’s not the whole story. A couple of the other PRNGS have advantages that situationally makes them better suited than xoroshiro128+. I’ll go over these in the discussion below.
These two versions of GCC and Clang were chosen because these are the latest available in Debian 9 “Stretch.” It’s easy to build and run the benchmark yourself if you want to try a different version.
In the speed benchmark, the PRNG is initialized, a 1-second alarm(1)
is set, then the PRNG fills a large volatile
buffer of 64-bit unsigned
integers again and again as quickly as possible until the alarm fires.
The amount of memory written is measured as the PRNG’s speed.
The baseline “PRNG” writes zeros into the buffer. This represents the absolute speed limit that no PRNG can exceed.
The purpose for making the buffer volatile
is to force the entire
output to actually be “consumed” as far as the compiler is concerned.
Otherwise the compiler plays nasty tricks to make the program do as
little work as possible. Another way to deal with this would be to
write(2)
buffer, but of course I didn’t want to introduce
unnecessary I/O into a benchmark.
On Linux, SIGALRM was impressively consistent between runs, meaning it was perfectly suitable for this benchmark. To account for any process scheduling wonkiness, the bench mark was run 8 times and only the fastest time was kept.
The SIGALRM handler sets a volatile
global variable that tells the
generator to stop. The PRNG call was unrolled 8 times to avoid the
alarm check from significantly impacting the benchmark. You can see
the effect for yourself by changing UNROLL
to 1 (i.e. “don’t
unroll”) in the code. Unrolling beyond 8 times had no measurable
effect to my tests.
Due to the PRNGs being inlined, this unrolling makes the benchmark
less realistic, and it shows in the results. Using volatile
for the
buffer helped to counter this effect and reground the results. This is
a fuzzy problem, and there’s not really any way to avoid it, but I
will also discuss this below.
To measure the statistical quality of each PRNG — mostly as a sanity check — the raw binary output was run through dieharder 3.31.1:
prng | dieharder -g200 -a -m4
This statistical analysis has no timing characteristics and the results should be the same everywhere. You would only need to re-run it to test with a different version of dieharder, or a different analysis tool.
There’s not much information to glean from this part of the shootout. It mostly confirms that all of these PRNGs would work fine for simulation purposes. The WEAK results are not very significant and is only useful for breaking ties. Even a true RNG will get some WEAK results. For example, the x86 RDRAND instruction (not included in actual shootout) got 7 WEAK results in my tests.
The FAIL results are more significant, but a single failure doesn’t mean much. A non-failing PRNG should be preferred to an otherwise equal PRNG with a failure.
Admittedly the definition for “64-bit PRNG” is rather vague. My high performance targets are all 64-bit platforms, so the highest PRNG throughput will be built on 64-bit operations (if not wider). The original plan was to focus on PRNGs built from 64-bit operations.
Curiosity got the best of me, so I included some PRNGs that don’t use any 64-bit operations. I just wanted to see how they stacked up.
One of the reasons I wrote a Blowfish implementation was to evaluate its performance and statistical qualities, so naturally I included it in the benchmark. It only uses 32-bit addition and 32-bit XOR. It has a 64-bit block size, so it’s naturally producing a 64-bit integer. There are two different properties that combine to make four variants in the benchmark: number of rounds and block mode.
Blowfish normally uses 16 rounds. This makes it a lot slower than a non-cryptographic PRNG but gives it a security margin. I don’t care about the security margin, so I included a 4-round variant. At expected, it’s about four times faster.
The other feature I tested is the block mode: Cipher Block Chaining (CBC) versus Counter (CTR) mode. In CBC mode it encrypts zeros as plaintext. This just means it’s encrypting its last output. The ciphertext is the PRNG’s output.
In CTR mode the PRNG is encrypting a 64-bit counter. It’s 11% faster than CBC in the 16-round variant and 23% faster in the 4-round variant. The reason is simple, and it’s in part an artifact of unrolling the generation loop in the benchmark.
In CBC mode, each output depends on the previous, but in CTR mode all
blocks are independent. Work can begin on the next output before the
previous output is complete. The x86 architecture uses out-of-order
execution to achieve many of its performance gains: Instructions may
be executed in a different order than they appear in the program,
though their observable effects must generally be ordered
correctly. Breaking dependencies between instructions allows
out-of-order execution to be fully exercised. It also gives the
compiler more freedom in instruction scheduling, though the volatile
accesses cannot be reordered with respect to each other (hence it
helping to reground the benchmark).
Statistically, the 4-round cipher was not significantly worse than the 16-round cipher. For simulation purposes the 4-round cipher would be perfectly sufficient, though xoroshiro128+ is still more than 9 times faster without sacrificing quality.
On the other hand, CTR mode had a single failure in both the 4-round (dab_filltree2) and 16-round (dab_filltree) variants. At least for Blowfish, is there something that makes CTR mode less suitable than CBC mode as a PRNG?
In the end Blowfish is too slow and too complicated to serve as a simulation PRNG. This was entirely expected, but it’s interesting to see how it stacks up.
Nobody ever got fired for choosing Mersenne Twister. It’s the classical choice for simulations, and is still usually recommended to this day. However, Mersenne Twister’s best days are behind it. I tested the 64-bit variant, MT19937-64, and there are four problems:
It’s between 1/4 and 1/5 the speed of xoroshiro128+.
It’s got a large state: 2,500 bytes. Versus xoroshiro128+’s 16 bytes.
Its implementation is three times bigger than xoroshiro128+, and much more complicated.
It had one statistical failure (dab_filltree2).
Curiously my implementation is 16% faster with Clang than GCC. Since Mersenne Twister isn’t seriously in the running, I didn’t take time to dig into why.
Ultimately I would never choose Mersenne Twister for anything anymore. This was also not surprising.
The Permuted Congruential Generator (PCG) has some really interesting history behind it, particularly with its somewhat unusual paper, controversial for both its excessive length (58 pages) and informal style. It’s in close competition with Xorshift and xoroshiro128+. I was really interested in seeing how it stacked up.
PCG is really just a Linear Congruential Generator (LCG) that doesn’t output the lowest bits (too poor quality), and has an extra permutation step to make up for the LCG’s other weaknesses. I included two variants in my benchmark: the official PCG and a “simplified” PCG (sPCG) with a simple permutation step. sPCG is just the first PCG presented in the paper (34 pages in!).
Here’s essentially what the simplified version looks like:
uint32_t
spcg32(uint64_t s[1])
{
uint64_t m = 0x9b60933458e17d7d;
uint64_t a = 0xd737232eeccdf7ed;
*s = *s * m + a;
int shift = 29 - (*s >> 61);
return *s >> shift;
}
The third line with the modular multiplication and addition is the LCG. The bit shift is the permutation. This PCG uses the most significant three bits of the result to determine which 32 bits to output. That’s the novel component of PCG.
The two constants are entirely my own devising. It’s two 64-bit primes
generated using Emacs’ M-x calc
: 2 64 ^ k r k n k p k p k p
.
Heck, that’s so simple that I could easily memorize this and code it from scratch on demand. Key takeaway: This is one way that PCG is situationally better than xoroshiro128+. In a pinch I could use Emacs to generate a couple of primes and code the rest from memory. If you participate in coding competitions, take note.
However, you probably also noticed PCG only generates 32-bit integers despite using 64-bit operations. To properly generate a 64-bit value we’d need 128-bit operations, which would need to be implemented in software.
Instead, I doubled up on everything to run two PRNGs in parallel. Despite the doubling in state size, the period doesn’t get any larger since the PRNGs don’t interact with each other. We get something in return, though. Remember what I said about out-of-order execution? Except for the last step combining their results, since the two PRNGs are independent, doubling up shouldn’t quite halve the performance, particularly with the benchmark loop unrolling business.
Here’s my doubled-up version:
uint64_t
spcg64(uint64_t s[2])
{
uint64_t m = 0x9b60933458e17d7d;
uint64_t a0 = 0xd737232eeccdf7ed;
uint64_t a1 = 0x8b260b70b8e98891;
uint64_t p0 = s[0];
uint64_t p1 = s[1];
s[0] = p0 * m + a0;
s[1] = p1 * m + a1;
int r0 = 29 - (p0 >> 61);
int r1 = 29 - (p1 >> 61);
uint64_t high = p0 >> r0;
uint32_t low = p1 >> r1;
return (high << 32) | low;
}
The “full” PCG has some extra shifts that makes it 25% (GCC) to 50% (Clang) slower than the “simplified” PCG, but it does halve the WEAK results.
In this 64-bit form, both are significantly slower than xoroshiro128+. However, if you find yourself only needing 32 bits at a time (always throwing away the high 32 bits from a 64-bit PRNG), 32-bit PCG is faster than using xoroshiro128+ and throwing away half its output.
This is another CSPRNG where I was curious how it would stack up. It only uses 8-bit operations, and it generates a 64-bit integer one byte at a time. It’s the slowest after 16-round Blowfish and generally not useful as a simulation PRNG.
xoroshiro128+ is the obvious winner in this benchmark and it seems to be the best 64-bit simulation PRNG available. If you need a fast, quality PRNG, just drop these 11 lines into your C or C++ program:
uint64_t
xoroshiro128plus(uint64_t s[2])
{
uint64_t s0 = s[0];
uint64_t s1 = s[1];
uint64_t result = s0 + s1;
s1 ^= s0;
s[0] = ((s0 << 55) | (s0 >> 9)) ^ s1 ^ (s1 << 14);
s[1] = (s1 << 36) | (s1 >> 28);
return result;
}
There’s one important caveat: That 16-byte state must be well-seeded. Having lots of zero bytes will lead terrible initial output until the generator mixes it all up. Having all zero bytes will completely break the generator. If you’re going to seed from, say, the unix epoch, then XOR it with 16 static random bytes.
These generators are closely related and, like I said, xorshift64* was what I used for years. Looks like it’s time to retire it.
uint64_t
xorshift64star(uint64_t s[1])
{
uint64_t x = s[0];
x ^= x >> 12;
x ^= x << 25;
x ^= x >> 27;
s[0] = x;
return x * UINT64_C(0x2545f4914f6cdd1d);
}
However, unlike both xoroshiro128+ and xorshift128+, xorshift64* will tolerate weak seeding so long as it’s not literally zero. Zero will also break this generator.
If it weren’t for xoroshiro128+, then xorshift128+ would have been the winner of the benchmark and my new favorite choice.
uint64_t
xorshift128plus(uint64_t s[2])
{
uint64_t x = s[0];
uint64_t y = s[1];
s[0] = y;
x ^= x << 23;
s[1] = x ^ y ^ (x >> 17) ^ (y >> 26);
return s[1] + y;
}
It’s a lot like xoroshiro128+, including the need to be well-seeded, but it’s just slow enough to lose out. There’s no reason to use xorshift128+ instead of xoroshiro128+.
My own takeaway (until I re-evaluate some years in the future):
Things can change significantly between platforms, though. Here’s the shootout on a ARM Cortex-A53:
Speed (MB/s)
PRNG gcc-5.4.0 clang-3.8.0
------------------------------------
baseline 2560 2400
blowfishcbc16 36.5 45.4
blowfishcbc4 135 173
blowfishctr16 36.4 45.2
blowfishctr4 133 168
mt64 207 254
pcg64 980 712
rc4 96.6 44.0
spcg64 1021 948
xoroshiro128+ 2560 1570
xorshift128+ 2560 1520
xorshift64* 1360 1080
LLVM is not as mature on this platform, but, with GCC, both xoroshiro128+ and xorshift128+ matched the baseline! It seems memory is the bottleneck.
So don’t necessarily take my word for it. You can run this shootout in your own environment — perhaps even tossing in more PRNGs — to find what’s appropriate for your own situation.
]]>qsort()
and bsearch()
, each requiring a
comparator function in order to operate on arbitrary types.
void qsort(void *base, size_t nmemb, size_t size,
int (*compar)(const void *, const void *));
void *bsearch(const void *key, const void *base,
size_t nmemb, size_t size,
int (*compar)(const void *, const void *));
A problem with these functions is that there’s no way to pass context to the callback. The callback may need information beyond the two element pointers when making its decision, or to update a result. For example, suppose I have a structure representing a two-dimensional coordinate, and a coordinate distance function.
struct coord {
float x;
float y;
};
static inline float
distance(const struct coord *a, const struct coord *b)
{
float dx = a->x - b->x;
float dy = a->y - b->y;
return sqrtf(dx * dx + dy * dy);
}
If I have an array of coordinates and I want to sort them based on
their distance from some target, the comparator needs to know the
target. However, the qsort()
interface has no way to directly pass
this information. Instead it has to be passed by another means, such
as a global variable.
struct coord *target;
int
coord_cmp(const void *a, const void *b)
{
float dist_a = distance(a, target);
float dist_b = distance(b, target);
if (dist_a < dist_b)
return -1;
else if (dist_a > dist_b)
return 1;
else
return 0;
}
And its usage:
size_t ncoords = /* ... */;
struct coords *coords = /* ... */;
struct current_target = { /* ... */ };
// ...
target = ¤t_target
qsort(coords, ncoords, sizeof(coords[0]), coord_cmp);
Potential problems are that it’s neither thread-safe nor re-entrant. Two different threads cannot use this comparator at the same time. Also, on some platforms and configurations, repeatedly accessing a global variable in a comparator may have a significant cost. A common workaround for thread safety is to make the global variable thread-local by allocating it in thread-local storage (TLS):
_Thread_local struct coord *target; // C11
__thread struct coord *target; // GCC and Clang
__declspec(thread) struct coord *target; // Visual Studio
This makes the comparator thread-safe. However, it’s still not re-entrant (usually unimportant) and accessing thread-local variables on some platforms is even more expensive — which is the situation for Pthreads TLS, though not a problem for native x86-64 TLS.
Modern libraries usually provide some sort of “user data” pointer — a
generic pointer that is passed to the callback function as an
additional argument. For example, the GNU C Library has long had
qsort_r()
: re-entrant qsort.
void qsort_r(void *base, size_t nmemb, size_t size,
int (*compar)(const void *, const void *, void *),
void *arg);
The new comparator looks like this:
int
coord_cmp_r(const void *a, const void *b, void *target)
{
float dist_a = distance(a, target);
float dist_b = distance(b, target);
if (dist_a < dist_b)
return -1;
else if (dist_a > dist_b)
return 1;
else
return 0;
}
And its usage:
void *arg = ¤t_target;
qsort_r(coords, ncoords, sizeof(coords[0]), coord_cmp_r, arg);
User data arguments are thread-safe, re-entrant, performant, and perfectly portable. They completely and cleanly solve the entire problem with virtually no drawbacks. If every library did this, there would be nothing left to discuss and this article would be boring.
In order to make things more interesting, suppose you’re stuck calling a function in some old library that takes a callback but doesn’t support a user data argument. A global variable is insufficient, and the thread-local storage solution isn’t viable for one reason or another. What do you do?
The core problem is that a function pointer is just an address, and it’s the same address no matter the context for any particular callback. On any particular call, the callback has three ways to distinguish this call from other calls. These align with the three solutions above:
A wholly different approach is to use a unique function pointer for
each callback. The callback could then inspect its own address to
differentiate itself from other callbacks. Imagine defining multiple
instances of coord_cmp
each getting their context from a different
global variable. Using a unique copy of coord_cmp
on each thread for
each usage would be both re-entrant and thread-safe, and wouldn’t
require TLS.
Taking this idea further, I’d like to generate these new functions on demand at run time akin to a JIT compiler. This can be done as a library, mostly agnostic to the implementation of the callback. Here’s an example of what its usage will be like:
void *closure_create(void *f, int nargs, void *userdata);
void closure_destroy(void *);
The callback to be converted into a closure is f
and the number of
arguments it takes is nargs
. A new closure is allocated and returned
as a function pointer. This closure takes nargs - 1
arguments, and
it will call the original callback with the additional argument
userdata
.
So, for example, this code uses a closure to convert coord_cmp_r
into a function suitable for qsort()
:
int (*closure)(const void *, const void *);
closure = closure_create(coord_cmp_r, 3, ¤t_target);
qsort(coords, ncoords, sizeof(coords[0]), closure);
closure_destroy(closure);
Caveat: This API is utterly insufficient for any sort of portability. The number of arguments isn’t nearly enough information for the library to generate a closure. For practically every architecture and ABI, it’s going to depend on the types of each of those arguments. On x86-64 with the System V ABI — where I’ll be implementing this — this argument will only count integer/pointer arguments. To find out what it takes to do this properly, see the libjit documentation.
This implementation will be for x86-64 Linux, though the high level details will be the same for any program running in virtual memory. My closures will span exactly two consecutive pages (typically 8kB), though it’s possible to use exactly one page depending on the desired trade-offs. The reason I need two pages are because each page will have different protections.
Native code — the thunk — lives in the upper page. The user data pointer and callback function pointer lives at the high end of the lower page. The two pointers could really be anywhere in the lower page, and they’re only at the end for aesthetic reasons. The thunk code will be identical for all closures of the same number of arguments.
The upper page will be executable and the lower page will be writable. This allows new pointers to be set without writing to executable thunk memory. In the future I expect operating systems to enforce W^X (“write xor execute”), and this code will already be compliant. Alternatively, the pointers could be “baked in” with the thunk page and immutable, but since creating closure requires two system calls, I figure it’s better that the pointers be mutable and the closure object reusable.
The address for the closure itself will be the upper page, being what other functions will call. The thunk will load the user data pointer from the lower page as an additional argument, then jump to the actual callback function also given by the lower page.
The x86-64 thunk assembly for a 2-argument closure calling a 3-argument callback looks like this:
user: dq 0
func: dq 0
;; --- page boundary here ---
thunk2:
mov rdx, [rel user]
jmp [rel func]
As a reminder, the integer/pointer argument register order for the
System V ABI calling convention is: rdi
, rsi
, rdx
, rcx
, r8
,
r9
. The third argument is passed through rdx
, so the user pointer
is loaded into this register. Then it jumps to the callback address
with the original arguments still in place, plus the new argument. The
user
and func
values are loaded RIP-relative (rel
) to the
address of the code. The thunk is using the callback address (its own
address) to determine the context.
The assembled machine code for the thunk is just 13 bytes:
unsigned char thunk2[16] = {
// mov rdx, [rel user]
0x48, 0x8b, 0x15, 0xe9, 0xff, 0xff, 0xff,
// jmp [rel func]
0xff, 0x25, 0xeb, 0xff, 0xff, 0xff
}
All closure_create()
has to do is allocate two pages, copy this
buffer into the upper page, adjust the protections, and return the
address of the thunk. Since closure_create()
will work for nargs
number of arguments, there will actually be 6 slightly different
thunks, one for each of the possible register arguments (rdi
through
r9
).
static unsigned char thunk[6][13] = {
{
0x48, 0x8b, 0x3d, 0xe9, 0xff, 0xff, 0xff,
0xff, 0x25, 0xeb, 0xff, 0xff, 0xff
}, {
0x48, 0x8b, 0x35, 0xe9, 0xff, 0xff, 0xff,
0xff, 0x25, 0xeb, 0xff, 0xff, 0xff
}, {
0x48, 0x8b, 0x15, 0xe9, 0xff, 0xff, 0xff,
0xff, 0x25, 0xeb, 0xff, 0xff, 0xff
}, {
0x48, 0x8b, 0x0d, 0xe9, 0xff, 0xff, 0xff,
0xff, 0x25, 0xeb, 0xff, 0xff, 0xff
}, {
0x4C, 0x8b, 0x05, 0xe9, 0xff, 0xff, 0xff,
0xff, 0x25, 0xeb, 0xff, 0xff, 0xff
}, {
0x4C, 0x8b, 0x0d, 0xe9, 0xff, 0xff, 0xff,
0xff, 0x25, 0xeb, 0xff, 0xff, 0xff
},
};
Given a closure pointer returned from closure_create()
, here are the
setter functions for setting the closure’s two pointers.
void
closure_set_data(void *closure, void *data)
{
void **p = closure;
p[-2] = data;
}
void
closure_set_function(void *closure, void *f)
{
void **p = closure;
p[-1] = f;
}
In closure_create()
, allocation is done with an anonymous mmap()
,
just like in my JIT compiler. It’s initially mapped writable in
order to copy the thunk, then the thunk page is set to executable.
void *
closure_create(void *f, int nargs, void *userdata)
{
long page_size = sysconf(_SC_PAGESIZE);
int prot = PROT_READ | PROT_WRITE;
int flags = MAP_ANONYMOUS | MAP_PRIVATE;
char *p = mmap(0, page_size * 2, prot, flags, -1, 0);
if (p == MAP_FAILED)
return 0;
void *closure = p + page_size;
memcpy(closure, thunk[nargs - 1], sizeof(thunk[0]));
mprotect(closure, page_size, PROT_READ | PROT_EXEC);
closure_set_function(closure, f);
closure_set_data(closure, userdata);
return closure;
}
Destroying a closure is done by computing the lower page address and
calling munmap()
on it:
void
closure_destroy(void *closure)
{
long page_size = sysconf(_SC_PAGESIZE);
munmap((char *)closure - page_size, page_size * 2);
}
And that’s it! You can see the entire demo here:
It’s a lot simpler for x86-64 than it is for x86, where there’s no RIP-relative addressing and arguments are passed on the stack. The arguments must all be copied back onto the stack, above the new argument, and it cannot be a tail call since the stack has to be fixed before returning. Here’s what the thunk looks like for a 2-argument closure:
data: dd 0
func: dd 0
;; --- page boundary here ---
thunk2:
call .rip2eax
.rip2eax:
pop eax
push dword [eax - 13]
push dword [esp + 12]
call [eax - 9]
add esp, 12
ret
Exercise for the reader: Port the closure demo to a different architecture or to the the Windows x64 ABI.
]]>Consider this simple C code sample.
static const float values[] = {1.1f, 1.2f, 1.3f, 1.4f};
float get_value(unsigned x)
{
return x < 4 ? values[x] : 0.0f;
}
This function needs the base address of values
in order to
dereference it for values[x]
. The easiest way to find out how this
works, especially without knowing where to start, is to compile the
code and have a look! I’ll compile for x86-64 with GCC 4.9.2 (Debian
Jessie).
$ gcc -c -Os -fPIC get_value.c
I optimized for size (-Os
) to make the disassembly easier to follow.
Next, disassemble this pre-linked code with objdump
. Alternatively I
could have asked for the compiler’s assembly output with -S
, but
this will be good reverse engineering practice.
$ objdump -d -Mintel get_value.o
0000000000000000 <get_value>:
0: 83 ff 03 cmp edi,0x3
3: 0f 57 c0 xorps xmm0,xmm0
6: 77 0e ja 16 <get_value+0x16>
8: 48 8d 05 00 00 00 00 lea rax,[rip+0x0]
f: 89 ff mov edi,edi
11: f3 0f 10 04 b8 movss xmm0,DWORD PTR [rax+rdi*4]
16: c3 ret
There are a couple of interesting things going on, but let’s start from the beginning.
The ABI specifies that the first integer/pointer argument
(the 32-bit integer x
) is passed through the edi
register. The
function compares x
to 3, to satisfy x < 4
.
The ABI specifies that floating point values are returned through
the SSE2 SIMD register xmm0
. It’s cleared by XORing the
register with itself — the conventional way to clear registers on
x86 — setting up for a return value of 0.0f
.
It then uses the result of the previous comparison to perform a
jump, ja
(“jump if after”). That is, jump to the relative address
specified by the jump’s operand if the first operand to cmp
(edi
) comes after the first operand (0x3
) as unsigned values.
Its cousin, jg
(“jump if greater”), is for signed values. If x
is outside the array bounds, it jumps straight to ret
, returning
0.0f
.
If x
was in bounds, it uses a lea
(“load effective address”) to
load something into the 64-bit rax
register. This is the
complicated bit, and I’ll start by giving the answer: The value
loaded into rax
is the address of the values
array. More on
this in a moment.
Finally it uses x
as an index into address in rax
. The movss
(“move scalar single-precision”) instruction loads a 32-bit float
into the first lane of xmm0
, where the caller expects to find the
return value. This is all preceded by a mov edi, edi
which
looks like a hotpatch nop, but it isn’t. x86-64 always uses
64-bit registers for addressing, meaning it uses rdi
not edi
.
All 32-bit register assignments clear the upper 32 bits, and so
this mov
zero-extends edi
into rdi
. This is in case of the
unlikely event that the caller left garbage in those upper bits.
xmm0
The first interesting part: xmm0
is cleared even when its first lane
is loaded with a value. There are two reasons to do this.
The obvious reason is that the alternative requires additional
instructions, and I told GCC to optimize for size. It would need
either an extra ret
or an conditional jmp
over the “else” branch.
The less obvious reason is that it breaks a data dependency. For
over 20 years now, x86 micro-architectures have employed an
optimization technique called register renaming. Architectural
registers (rax
, edi
, etc.) are just temporary names for
underlying physical registers. This disconnect allows for more
aggressive out-of-order execution. Two instructions sharing an
architectural register can be executed independently so long as there
are no data dependencies between these instructions.
For example, take this assembly sample. It assembles to 9 bytes of machine code.
mov edi, [rcx]
mov ecx, 7
shl eax, cl
This reads a 32-bit value from the address stored in rcx
, then
assigns ecx
and uses cl
(the lowest byte of rcx
) in a shift
operation. Without register renaming, the shift couldn’t be performed
until the load in the first instruction completed. However, the second
instruction is a 32-bit assignment, which, as I mentioned before, also
clears the upper 32 bits of rcx
, wiping the unused parts of
register.
So after the second instruction, it’s guaranteed that the value in
rcx
has no dependencies on code that comes before it. Because of
this, it’s likely a different physical register will be used for the
second and third instructions, allowing these instructions to be
executed out of order, before the load. Ingenious!
Compare it to this example, where the second instruction assigns to
cl
instead of ecx
. This assembles to just 6 bytes.
mov edi, [rcx]
mov cl, 7
shl eax, cl
The result is 3 bytes smaller, but since it’s not a 32-bit assignment,
the upper bits of rcx
still hold the original register contents.
This creates a false dependency and may prevent out-of-order
execution, reducing performance.
By clearing xmm0
, instructions in get_value
involving xmm0
have
the opportunity to be executed prior to instructions in the callee
that use xmm0
.
Going back to the instruction that computes the address of values
.
8: 48 8d 05 00 00 00 00 lea rax,[rip+0x0]
Normally load/store addresses are absolute, based off an address
either in a general purpose register, or at some hard-coded base
address. The latter is not an option in relocatable code. With
RIP-relative addressing that’s still the case, but the register with
the absolute address is rip
, the instruction pointer. This
addressing mode was introduced in x86-64 to make relocatable code more
efficient.
That means this instruction copies the instruction pointer (pointing
to the next instruction) into rax
, plus a 32-bit displacement,
currently zero. This isn’t the right way to encode a displacement of
zero (unless you want a larger instruction). That’s because the
displacement will be filled in later by the linker. The compiler adds
a relocation entry to the object file so that the linker knows how
to do this.
On platforms that use ELF we can inspect relocations this with
readelf
.
$ readelf -r get_value.o
Relocation section '.rela.text' at offset 0x270 contains 1 entries:
Offset Info Type Sym. Value
00000000000b 000700000002 R_X86_64_PC32 0000000000000000 .rodata - 4
The relocation type is R_X86_64_PC32
. In the AMD64 Architecture
Processor Supplement, this is defined as “S + A - P”.
S: Represents the value of the symbol whose index resides in the relocation entry.
A: Represents the addend used to compute the value of the relocatable field.
P: Represents the place of the storage unit being relocated.
The symbol, S, is .rodata
— the final address for this object file’s
portion of .rodata
(where values
resides). The addend, A, is -4
since the instruction pointer points at the next instruction. That
is, this will be relative to four bytes after the relocation offset.
Finally, the address of the relocation, P, is the address of last four
bytes of the lea
instruction. These values are all known at
link-time, so no run-time support is necessary.
Being “S - P” (overall), this will be the displacement between these two addresses: the 32-bit value is relative. It’s relocatable so long as these two parts of the binary (code and data) maintain a fixed distance from each other. The binary is relocated as a whole, so this assumption holds.
Since RIP-relative addressing wasn’t introduced until x86-64, how did
this all work on x86? Again, let’s just see what the compiler does.
Add the -m32
flag for a 32-bit target, and -fomit-frame-pointer
to
make it simpler for explanatory purposes.
$ gcc -c -m32 -fomit-frame-pointer -Os -fPIC get_value.c
$ objdump -d -Mintel get_value.o
00000000 <get_value>:
0: 8b 44 24 04 mov eax,DWORD PTR [esp+0x4]
4: d9 ee fldz
6: e8 fc ff ff ff call 7 <get_value+0x7>
b: 81 c1 02 00 00 00 add ecx,0x2
11: 83 f8 03 cmp eax,0x3
14: 77 09 ja 1f <get_value+0x1f>
16: dd d8 fstp st(0)
18: d9 84 81 00 00 00 00 fld DWORD PTR [ecx+eax*4+0x0]
1f: c3 ret
Disassembly of section .text.__x86.get_pc_thunk.cx:
00000000 <__x86.get_pc_thunk.cx>:
0: 8b 0c 24 mov ecx,DWORD PTR [esp]
3: c3 ret
Hmm, this one includes an extra function.
In this calling convention, arguments are passed on the stack. The
first instruction loads the argument, x
, into eax
.
The fldz
instruction clears the x87 floating pointer return
register, just like clearing xmm0
in the x86-64 version.
Next it calls __x86.get_pc_thunk.cx
. The call pushes the
instruction pointer, eip
, onto the stack. This function reads
that value off the stack into ecx
and returns. In other words,
calling this function copies eip
into ecx
. It’s setting up to
load data at an address relative to the code. Notice the function
name starts with two underscores — a name which is reserved for
exactly for these sorts of implementation purposes.
Next a 32-bit displacement is added to ecx
. In this case it’s
2
, but, like before, this is actually going be filled in later by
the linker.
Then it’s just like before: a branch to optionally load a value.
The floating pointer load (fld
) is another relocation.
Let’s look at the relocations. There are three this time:
$ readelf -r get_value.o
Relocation section '.rel.text' at offset 0x2b0 contains 3 entries:
Offset Info Type Sym.Value Sym. Name
00000007 00000e02 R_386_PC32 00000000 __x86.get_pc_thunk.cx
0000000d 00000f0a R_386_GOTPC 00000000 _GLOBAL_OFFSET_TABLE_
0000001b 00000709 R_386_GOTOFF 00000000 .rodata
The first relocation is the call-site for the thunk. The thunk has
external linkage and may be merged with a matching thunk in another
object file, and so may be relocated. (Clang inlines its thunk.) Calls
are relative, so its type is R_386_PC32
: a code-relative
displacement just like on x86-64.
The next is of type R_386_GOTPC
and sets the second operand in that
add ecx
. It’s defined as “GOT + A - P” where “GOT” is the address of
the Global Offset Table — a table of addresses of the binary’s
relocated objects. Since values
is static, the GOT won’t actually
hold an address for it, but the relative address of the GOT itself
will be useful.
The final relocation is of type R_386_GOTOFF
. This is defined as
“S + A - GOT”. Another displacement between two addresses. This is the
displacement in the load, fld
. Ultimately the load adds these last
two relocations together, canceling the GOT:
(GOT + A0 - P) + (S + A1 - GOT)
= S + A0 + A1 - P
So the GOT isn’t relevant in this case. It’s just a mechanism for constructing a custom relocation type.
Notice in the x86 version the thunk is called before checking the
argument. What if it’s most likely that will x
be out of bounds of
the array, and the function usually returns zero? That means it’s
usually wasting its time calling the thunk. Without profile-guided
optimization the compiler probably won’t know this.
The typical way to provide such a compiler hint is with a pair of
macros, likely()
and unlikely()
. With GCC and Clang, these would
be defined to use __builtin_expect
. Compilers without this sort of
feature would have macros that do nothing instead. So I gave it a
shot:
#define likely(x) __builtin_expect((x),1)
#define unlikely(x) __builtin_expect((x),0)
static const float values[] = {1.1f, 1.2f, 1.3f, 1.4f};
float get_value(unsigned x)
{
return unlikely(x < 4) ? values[x] : 0.0f;
}
Unfortunately this makes no difference even in the latest version of GCC. In Clang it changes branch fall-through (for static branch prediction), but still always calls the thunk. It seems compilers have difficulty with optimizing relocatable code on x86.
It’s commonly understood that the advantage of 64-bit versus 32-bit systems is processes having access to more than 4GB of memory. But as this shows, there’s more to it than that. Even programs that don’t need that much memory can really benefit from newer features like RIP-relative addressing.
]]>struct event {
uint64_t time; // unix epoch (microseconds)
uint32_t size; // including this header (bytes)
uint16_t source;
uint16_t type;
};
The size
member is used to find the offset of the next structure in
the file without knowing anything else about the current structure.
Just add size
to the offset of the current structure.
The type
member indicates what kind of data follows this structure.
The program is likely to switch
on this value.
The actual structures might look something like this (in the spirit of
X-COM). Note how each structure begins with struct event
as
header. All angles are expressed using binary scaling.
#define EVENT_TYPE_OBSERVER 10
#define EVENT_TYPE_UFO_SIGHTING 20
#define EVENT_TYPE_SUSPICIOUS_SIGNAL 30
struct observer {
struct event event;
uint32_t latitude; // binary scaled angle
uint32_t longitude; //
uint16_t source_id; // later used for event source
uint16_t name_size; // not including null terminator
char name[];
};
struct ufo_sighting {
struct event event;
uint32_t azimuth; // binary scaled angle
uint32_t elevation; //
};
struct suspicious_signal {
struct event event;
uint16_t num_channels;
uint16_t sample_rate; // Hz
uint32_t num_samples; // per channel
int16_t samples[];
};
If all integers are stored in little endian byte order (least significant byte first), there’s a strong temptation to lay the structures directly over the data. After all, this will work correctly on most computers.
struct event header;
fread(buffer, sizeof(header), 1, file);
switch (header.type) {
// ...
}
This code will not work correctly when:
The host machine doesn’t use little endian byte order, though this is now uncommon. Sometimes developers will attempt to detect the byte order at compile time and use the preprocessor to byte-swap if needed. This is a mistake.
The host machine has different alignment requirements and so
introduces additional padding to the structure. Sometimes this can
be resolved with a non-standard #pragma pack
.
Fortunately it’s easy to write fast, correct, portable code for this
situation. First, define some functions to extract little endian
integers from an octet buffer (uint8_t
). These will work correctly
regardless of the host’s alignment and byte order.
static inline uint16_t
extract_u16le(const uint8_t *buf)
{
return (uint16_t)buf[1] << 8 |
(uint16_t)buf[0] << 0;
}
static inline uint32_t
extract_u32le(const uint8_t *buf)
{
return (uint32_t)buf[3] << 24 |
(uint32_t)buf[2] << 16 |
(uint32_t)buf[1] << 8 |
(uint32_t)buf[0] << 0;
}
static inline uint64_t
extract_u64le(const uint8_t *buf)
{
return (uint64_t)buf[7] << 56 |
(uint64_t)buf[6] << 48 |
(uint64_t)buf[5] << 40 |
(uint64_t)buf[4] << 32 |
(uint64_t)buf[3] << 24 |
(uint64_t)buf[2] << 16 |
(uint64_t)buf[1] << 8 |
(uint64_t)buf[0] << 0;
}
The big endian version is identical, but with shifts in reverse order.
A common concern is that these functions are a lot less efficient than
they could be. On x86 where alignment is very relaxed, each could be
implemented as a single load instruction. However, on GCC 4.x and
earlier, extract_u32le
compiles to something like this:
extract_u32le:
movzx eax, [rdi+3]
sal eax, 24
mov edx, eax
movzx eax, [rdi+2]
sal eax, 16
or eax, edx
movzx edx, [rdi]
or eax, edx
movzx edx, [rdi+1]
sal edx, 8
or eax, edx
ret
It’s tempting to fix the problem with the following definition:
// Note: Don't do this.
static inline uint32_t
extract_u32le(const uint8_t *buf)
{
return *(uint32_t *)buf;
}
It’s unportable, it’s undefined behavior, and worst of all, it might not work correctly even on x86. Fortunately I have some great news. On GCC 5.x and above, the correct definition compiles to the desired, fast version. It’s the best of both worlds.
extract_u32le:
mov eax, [rdi]
ret
It’s even smart about the big endian version:
static inline uint32_t
extract_u32be(const uint8_t *buf)
{
return (uint32_t)buf[0] << 24 |
(uint32_t)buf[1] << 16 |
(uint32_t)buf[2] << 8 |
(uint32_t)buf[3] << 0;
}
Is compiled to exactly what you’d want:
extract_u32be:
mov eax, [rdi]
bswap eax
ret
Or, even better, if your system supports movbe
(gcc -mmovbe
):
extract_u32be:
movbe eax, [rdi]
ret
Unfortunately, Clang/LLVM is not this smart as of 3.9, but I’m betting it will eventually learn how to do this, too.
For this next technique, that struct event
from above need not
actually be in the source. It’s purely documentation. Instead, let’s
define the structure in terms of member offset constants — a term I
just made up for this article. I’ve included the integer types as part
of the name to aid in their correct use.
#define EVENT_U64LE_TIME 0
#define EVENT_U32LE_SIZE 8
#define EVENT_U16LE_SOURCE 12
#define EVENT_U16LE_TYPE 14
Given a buffer, the integer extraction functions, and these offsets, structure members can be plucked out on demand.
uint8_t *buf;
// ...
uint64_t time = extract_u64le(buf + EVENT_U64LE_TIME);
uint32_t size = extract_u32le(buf + EVENT_U32LE_SIZE;
uint16_t source = extract_u16le(buf + EVENT_U16LE_SOURCE);
uint16_t type = extract_u16le(buf + EVENT_U16LE_TYPE);
On x86 with GCC 5.x, each member access will be inlined and compiled to a one-instruction extraction. As far as performance is concerned, it’s identical to using a structure overlay, but this time the C code is clean and portable. A slight downside is the lack of type checking on member access: it’s easy to mismatch the types and accidentally read garbage.
There’s a real advantage to memory mapping the input file and using its contents directly. On a system with a huge virtual address space, such as x86-64 or AArch64, this memory is almost “free.” Already being backed by a file, paging out this memory costs nothing (i.e. it’s discarded). The input file can comfortably be much larger than physical memory without straining the system.
Unportable structure overlay can take advantage of memory mapping this way, but has the previously-described issues. An approach with member offset constants will take advantage of it just as well, all while remaining clean and portable.
I like to wrap the memory mapping code into a simple interface, which makes porting to non-POSIX platforms, such Windows, easier. Caveat: This won’t work with files whose size exceeds the available contiguous virtual memory of the system — a real problem for 32-bit systems.
#include <fcntl.h>
#include <unistd.h>
#include <sys/mman.h>
#include <sys/stat.h>
uint8_t *
map_file(const char *path, size_t *length)
{
int fd = open(path, O_RDONLY);
if (fd == -1)
return 0;
struct stat stat;
if (fstat(fd, &stat) == -1) {
close(fd);
return 0;
}
*length = stat.st_size; // TODO: possible overflow
uint8_t *p = mmap(0, *length, PROT_READ, MAP_PRIVATE, fd, 0);
close(fd);
return p != MAP_FAILED ? p : 0;
}
void
unmap_file(uint8_t *p, size_t length)
{
munmap(p, length);
}
Next, here’s an example that iterates over all the structures in
input_file
, in this case counting each. The size
member is
extracted in order to stride to the next structure.
size_t length;
uint8_t *data = map_file(input_file, &length);
if (!data)
FATAL();
size_t event_count = 0;
uint8_t *p = data;
while (p < data + length) {
event_count++;
uint32_t size = extract_u32le(p + EVENT_U32LE_SIZE);
if (size > length - (p - data))
FATAL(); // invalid size
p += size;
}
printf("I see %zu events.\n", event_count);
unmap_file(data, length);
This is the basic structure for navigating this kind of data. A deeper
dive would involve a switch
inside the loop, extracting the relevant
members for whatever use is needed.
Fast, correct, simple. Pick three.
]]>Most of the source code still exists, even for the compilers, and most computer systems will continue operating without disruption, but no new software can be developed unless it’s written byte by byte in raw machine code. Only real programmers can get anything done.
The world’s top software developers have been put to work bootstrapping a C compiler (and others) completely from scratch so that we can get back to normal. Without even an assembler, it’s a slow, tedious process.
In the mean time, rather than wait around for the bootstrap work to complete, the rest of us have been assigned individual programs hit by the virus. For example, many basic unix utilities have been wiped out, and the bootstrap would benefit from having them. Having different groups tackle each missing program will allow the bootstrap effort to move forward somewhat in parallel. At least that’s what the compiler nerds told us. The real reason is that they’re tired of being asked if they’re done yet, and these tasks will keep the rest of us quietly busy.
Fortunately you and I have been assigned the easiest task of all:
We’re to write the true
command from scratch. We’ll have to
figure it out byte by byte. The target is x86-64 Linux, which means
we’ll need the following documentation:
Executable and Linking Format (ELF) Specification. This is
the binary format used by modern Unix-like systems, including
Linux. A more convenient way to access this document is man 5
elf
.
Intel 64 and IA-32 Architectures Software Developer’s Manual (Volume 2). This fully documents the instruction set and its encoding. It’s all the information needed to write x86 machine code by hand. The AMD manuals would work too.
System V Application Binary Interface: AMD64 Architecture Processor Supplement. Only a few pieces of information are needed from this document, but more would be needed for a more substantial program.
Some magic numbers from header files.
The program we’re writing is true
, whose behavior is documented as
“do nothing, successfully.” All command line arguments are ignored and
no input is read. The program only needs to perform the exit system
call, immediately terminating the process.
According to the ABI document (3) Appendix A, the registers for system
call arguments are: rdi
, rsi
, rdx
, r10
, r8
, r9
. The system
call number goes in rax
. The exit system call takes only one
argument, and that argument will be 0 (success), so rdi
should be
set to zero. It’s likely that it’s already zero when the program
starts, but the ABI document says its contents are undefined (§3.4),
so we’ll set it explicitly.
For Linux on x86-64, the system call number for exit is 60,
(/usr/include/asm/unistd_64.h), so rax
will be set to 60, followed
by syscall
.
xor edi, edi
mov eax, 60
syscall
There’s no assembler available to turn this into machine code, so it has to be assembled by hand. For that we need the Intel manual (2).
The first instruction is xor
, so look up that mnemonic in the
manual. Like most x86 mnemonics, there are many different opcodes and
multiple ways to encode the same operation. For xor
, we have 22
opcodes to examine.
The operands are two 32-bit registers, so there are two options: opcodes 0x31 and 0x33.
31 /r XOR r/m32, r32
33 /r XOR r32, r/m32
The “r/m32” means the operand can be either a register or the address of a 32-bit region of memory. With two register operands, both encodings are equally valid, both have the same length (2 bytes), and neither is canonical, so the decision is entirely arbitrary. Let’s pick the first one, opcode 0x31, since it’s listed first.
The “/r” after the opcode means the register-only operand (“r32” in both cases) will be specified in the ModR/M byte. This is the byte that immediately follows the opcode and specifies one of two of the operands.
The ModR/M byte is broken into three parts: mod (2 bits), reg (3 bits), r/m (3 bits). This gets a little complicated, but if you stare at Table 2-1 in the Intel manual for long enough it eventually makes sense. In short, two high bits (11) for mod indicates we’re working with a register rather than a load. Here’s where we’re at for ModR/M:
11 ??? ???
The order of the x86 registers is unintuitive: ax
, cx
, dx
, bx
,
sp
, bp
, si
, di
. With 0-indexing, that gives di
a value of 7
(111 in binary). With edi
as both operands, this makes ModR/M:
11 111 111
Or, in hexadecimal, FF. And that’s it for this instruction. With the opcode (0x31) and the ModR/M byte (0xFF):
31 FF
The encoding for mov
is a bit different. Look it up and match the
operands. Like before, there are two possible options:
B8+rd id MOV r32, imm32
C7 /0 id MOV r/m32, imm32
In the B8+rd
notation means the 32-bit register operand (rd for
“register double word”) is added to the opcode instead of having a
ModR/M byte. It’s followed by a 32-bit immediate value (id for
“integer double word”). That’s a total of 5 bytes.
The “/0” in second means 0 goes in the “reg” field of ModR/M, and the whole instruction is followed by the 32-bit immediate (id). That’s a total of 6 bytes. Since this is longer, we’ll use the first encoding.
So, that’s opcode 0xB8 + 0
, since eax
is register number 0,
followed by 60 (0x3C) as a little endian, 4-byte value. Here’s the
encoding for the second instruction:
B8 3C 00 00 00
The final instruction is a cakewalk. There are no operands, it comes in only one form of two opcode bytes.
0F 05 SYSCALL
So the encoding for this instruction is:
0F 05
Putting it all together the program is 9 bytes:
31 FF B8 3C 00 00 00 0F 05
Aren’t you glad you don’t normally have to assemble entire programs by hand?
Back in the old days you may have been able to simply drop these bytes into a file and execute it. That’s how DOS COM programs worked. But this definitely won’t work if you tried it on Linux. Binaries must be in the Executable and Linking Format (ELF). This format tells the loader how to initialize the program in memory and how to start it.
Fortunately for this program we’ll only need to fill out two structures: the ELF header and one program header. The binary will be the ELF header, followed immediately by the program header, followed immediately by the program.
To fill this binary out, we’d use whatever method the virus left
behind for writing raw bytes to a file. For now I’ll assume the echo
command is still available, and we’ll use hexadecimal \xNN
escapes
to write raw bytes. If this isn’t available, you might need to use the
magnetic needle and steady hand method, or the butterflies.
The very first structure in an ELF file must be the ELF header, from the ELF specification (1):
typedef struct {
unsigned char e_ident[EI_NIDENT];
uint16_t e_type;
uint16_t e_machine;
uint32_t e_version;
ElfN_Addr e_entry;
ElfN_Off e_phoff;
ElfN_Off e_shoff;
uint32_t e_flags;
uint16_t e_ehsize;
uint16_t e_phentsize;
uint16_t e_phnum;
uint16_t e_shentsize;
uint16_t e_shnum;
uint16_t e_shstrndx;
} ElfN_Ehdr;
No other data is at a fixed location because this header specifies
where it can be found. If you’re writing a C program in the future,
once compilers have been bootstrapped back into existence, you can
access this structure in elf.h
.
The EI_NIDENT
macro is 16, so e_ident
is 16 bytes. The first 4
bytes are fixed: 0x7F, E, L, F.
The 5th byte is called EI_CLASS
: a 32-bit program (ELFCLASS32
=
1) or a 64-bit program (ELFCLASS64
= 2). This will be a 64-bit
program (2).
The 6th byte indicates the integer format (EI_DATA
). The one we want
for x86-64 is ELFDATA2LSB
(1), two’s complement, little-endian.
The 7th byte is the ELF version (EI_VERSION
), always 1 as of this
writing.
The 8th byte is the ABI (ELF_OSABI
), which in this case is
ELFOSABI_SYSV
(0).
The 9th byte is the version (EI_ABIVERSION
), which is just 0 again.
The rest is zero padding.
So writing the ELF header:
echo -ne '\x7FELF\x02\x01\x01\x00' > true
echo -ne '\x00\x00\x00\x00\x00\x00\x00\x00' >> true
The next field is the e_type
. This is an executable program, so it’s
ET_EXEC
(2). Other options are object files (ET_REL
= 1), shared
libraries (ET_DYN
= 3), and core files (ET_CORE
= 4).
echo -ne '\x02\x00' >> true
The value for e_machine
is EM_X86_64
(0x3E). This value isn’t in
the ELF specification but rather the ABI document (§4.1.1). On BSD
this is instead named EM_AMD64
.
echo -ne '\x3E\x00' >> true
For e_version
it’s always 1, like in the header.
echo -ne '\x01\x00\x00\x00' >> true
The e_entry
field will be 8 bytes because this is a 64-bit ELF. This
is the virtual address of the program’s entry point. It’s where the
loader will pass control and so it’s where we’ll load the program. The
typical entry address is somewhere around 0x400000. For a reason I’ll
explain shortly, our entry point will be 120 bytes (0x78) after that
nice round number, at 0x40000078.
echo -ne '\x78\x00\x00\x40\x00\x00\x00\x00' >> true
The e_phoff
field holds the offset of the program header table. The
ELF header is 64 bytes (0x40) and this structure will immediately
follow. It’s also 8 bytes.
echo -ne '\x40\x00\x00\x00\x00\x00\x00\x00' >> true
The e_shoff
header holds the offset of the section table. In an
executable program we don’t need sections, so this is zero.
echo -ne '\x00\x00\x00\x00\x00\x00\x00\x00' >> true
The e_flags
field has processor-specific flags, which in our case is
just 0.
echo -ne '\x00\x00\x00\x00' >> true
The e_ehsize
holds the size of the ELF header, which, as I said, is
64 bytes (0x40).
echo -ne '\x40\x00' >> true
The e_phentsize
is the size of one program header, which is 56 bytes
(0x38).
echo -ne '\x38\x00' >> true
The e_phnum
field indicates how many program headers there are. We
only need the one: the segment with the 9 program bytes, to be loaded
into memory.
echo -ne '\x01\x00' >> true
The e_shentsize
is the size of a section header. We’re not using
this, but we’ll do our due diligence. These are 64 bytes (0x40).
echo -ne '\x40\x00' >> true
The e_shnum
field is the number of sections (0).
echo -ne '\x00\x00' >> true
The e_shstrndx
is the index of the section with the string table. It
doesn’t exist, so it’s 0.
echo -ne '\x00\x00' >> true
Next is our program header.
typedef struct {
uint32_t p_type;
uint32_t p_flags;
Elf64_Off p_offset;
Elf64_Addr p_vaddr;
Elf64_Addr p_paddr;
uint64_t p_filesz;
uint64_t p_memsz;
uint64_t p_align;
} Elf64_Phdr;
The p_type
field indicates the segment type. This segment will hold
the program and will be loaded into memory, so we want PT_LOAD
(1).
Other kinds of segments set up dynamic loading and such.
echo -ne '\x01\x00\x00\x00' >> true
The p_flags
field gives the memory protections. We want executable
(PF_X
= 1) and readable (PF_R
= 4). These are ORed together to
make 5.
echo -ne '\x05\x00\x00\x00' >> true
The p_offset
is the file offset for the content of this segment.
This will be the program we assembled. It will immediately follow the
this header. The ELF header was 64 bytes, plus a 56 byte program
header, which is 120 (0x78).
echo -ne '\x78\x00\x00\x00\x00\x00\x00\x00' >> true
The p_vaddr
is the virtual address where this segment will be
loaded. This is the entry point from before. A restriction is that
this value must be congruent with p_offset
modulo the page size.
That’s why the entry point was offset by 120 bytes.
echo -ne '\x78\x00\x00\x40\x00\x00\x00\x00' >> true
The p_paddr
is unused for this platform.
echo -ne '\x00\x00\x00\x00\x00\x00\x00\x00' >> true
The p_filesz
is the size of the segment in the file: 9 bytes.
echo -ne '\x09\x00\x00\x00\x00\x00\x00\x00' >> true
The p_memsz
is the size of the segment in memory, also 9 bytes. It
might sound redundant, but these are allowed to differ, in which case
it’s either truncated or padded with zeroes.
echo -ne '\x09\x00\x00\x00\x00\x00\x00\x00' >> true
The p_align
indicates the segment’s alignment. We don’t care about
alignment.
echo -ne '\x00\x00\x00\x00\x00\x00\x00\x00' >> true
Finally, append the program we assembled at the beginning.
echo -ne '\x31\xFF\xB8\x3C\x00\x00\x00\x0F\x05' >> true
Set it executable (hopefully chmod
survived!):
chmod +x true
And test it:
./true && echo 'Success'
Here’s the whole thing as a shell script:
Is the C compiler done bootstrapping yet?
]]>char *
.
char *colors_ptr[] = {
"red",
"orange",
"yellow",
"green",
"blue",
"violet"
};
The other is a two-dimensional char
array.
char colors_2d[][7] = {
"red",
"orange",
"yellow",
"green",
"blue",
"violet"
};
The initializers are identical, and the syntax by which these tables are used is the same, but the underlying data structures are very different. For example, suppose I had a lookup() function that searches the table for a particular color.
int
lookup(const char *color)
{
int ncolors = sizeof(colors) / sizeof(colors[0]);
for (int i = 0; i < ncolors; i++)
if (strcmp(colors[i], color) == 0)
return i;
return -1;
}
Thanks to array decay — array arguments are implicitly converted to
pointers (§6.9.1-10) — it doesn’t matter if the table is char
colors[][7]
or char *colors[]
. It’s a little bit misleading because
the compiler generates different code depending on the type.
Here’s what colors_ptr
, a jagged array, typically looks like in
memory.
The array of six pointers will point into the program’s string table,
usually stored in a separate page. The strings aren’t in any
particular order and will be interspersed with the program’s other
string constants. The type of the expression colors_ptr[n]
is char *
.
On x86-64, suppose the base of the table is in rax
, the index of the
string I want to retrieve is rcx
, and I want to put the string’s
address back into rax
. It’s one load instruction.
mov rax, [rax + rcx*8]
Contrast this with colors_2d
: six 7-byte elements in a row. No
pointers or addresses. Only strings.
The strings are in their defined order, packed together. The type of
the expression colors_2d[n]
is char [7]
, an array rather than a
pointer. If this was a large table used by a hot function, it would
have friendlier cache characteristics — both in locality and
predictability.
In the same scenario before with x86-64, it takes two instructions to
put the string’s address in rax
, but neither is a load.
imul rcx, rcx, 7
add rax, rcx
In this particular case, the generated code can be slightly improved
by increasing the string size to 8 (e.g. char colors_2d[][8]
). The
multiply turns into a simple shift and the ALU no longer needs to be
involved, cutting it to one instruction. This looks like a load due to
the LEA (Load Effective Address), but it’s not.
lea rax, [rax + rcx*8]
There’s another factor to consider: relocation. Nearly every process running on a modern system takes advantage of a security feature called Address Space Layout Randomization (ASLR). The virtual address of code and data is randomized at process load time. For shared libraries, it’s not just a security feature, it’s essential to their basic operation. Libraries cannot possibly coordinate their preferred load addresses with every other library on the system, and so must be relocatable.
If the program is compiled with GCC or Clang configured for position
independent code — -fPIC
(for libraries) or -fpie
+ -pie
(for
programs) — extra work has to be done to support colors_ptr
. Those
are all addresses in the pointer array, but the compiler doesn’t know
what those addresses will be. The compiler fills the elements with
temporary values and adds six relocation entries to the binary, one
for each element. The loader will fill out the array at load time.
However, colors_2d
doesn’t have any addresses other than the address
of the table itself. The loader doesn’t need to be involved with each
of its elements. Score another point for the two-dimensional array.
On x86-64, in both cases the table itself typically doesn’t need a relocation entry because it will be RIP-relative (in the small code model). That is, code that uses the table will be at a fixed offset from the table no matter where the program is loaded. It won’t need to be looked up using the Global Offset Table (GOT).
In case you’re ever reading compiler output, in Intel syntax the
assembly for putting the table’s RIP-relative address in rax
looks
like so:
;; NASM:
lea rax, [rel address]
;; Some others:
lea rax, [rip + address]
Or in AT&T syntax:
lea address(%rip), %rax
Besides (trivially) more work for the loader, there’s another consequence to relocations: Pages containing relocations are not shared between processes (except after fork()). When loading a program, the loader doesn’t copy programs and libraries to memory so much as it memory maps their binaries with copy-on-write semantics. If another process is running with the same binaries loaded (e.g. libc.so), they’ll share the same physical memory so long as those pages haven’t been modified by either process. Modifying the page creates a unique copy for that process.
Relocations modify parts of the loaded binary, so these pages aren’t
shared. This means colors_2d
has the possibility of being shared
between processes, but colors_ptr
(and its entire page) definitely
does not. Shucks.
This is one of the reasons why the Procedure Linkage Table (PLT) exists. The PLT is an array of function stubs for shared library functions, such as those in the C standard library. Sure, the loader could go through the program and fill out the address of every library function call, but this would modify lots and lots of code pages, creating a unique copy of large parts of the program. Instead, the dynamic linker lazily supplies jump addresses for PLT function stubs, one per accessed library function.
However, as I’ve written it above, it’s unlikely that even colors_2d
will be shared. It’s still missing an important ingredient: const.
They say const isn’t for optimization but, darnit, this
situation keeps coming up. Since colors_ptr
and colors_2d
are both
global, writable arrays, the compiler puts them in the same writable
data section of the program, and, in my test program, they end up
right next to each other in the same page. The other relocations doom
colors_2d
to being a local copy.
Fortunately it’s trivial to fix by adding a const:
const char colors_2d[][7] = { /* ... */ };
Writing to this memory is now undefined behavior, so the compiler is
free to put it in read-only memory (.rodata
) and separate from the
dirty relocations. On my system, this is close enough to the code to
wind up in executable memory.
Note, the equivalent for colors_ptr
requires two const qualifiers,
one for the array and another for the strings. (Obviously the const
doesn’t apply to the loader.)
const char *const colors_ptr[] = { /* ... */ };
String literals are already effectively const, though the C specification (unlike C++) doesn’t actually define them to be this way. But, like setting your relationship status on Facebook, declaring it makes it official.
These little details are all deep down the path of micro-optimization and will rarely ever matter in practice, but perhaps you learned something broader from all this. This stuff fascinates me.
]]>MAP_FAILED
) on error and sets
errno. But how do you check errno without libc?
As a reminder here’s what the (unoptimized) assembly looks like.
stack_create:
mov rdi, 0
mov rsi, STACK_SIZE
mov rdx, PROT_WRITE | PROT_READ
mov r10, MAP_ANONYMOUS | MAP_PRIVATE | MAP_GROWSDOWN
mov rax, SYS_mmap
syscall
ret
As usual, the system call return value is in rax
, which becomes the
return value for stack_create()
. Again, its C prototype would look
like this:
void *stack_create(void);
If you were to, say, intentionally botch the arguments to force an error, you might notice that the system call isn’t returning -1, but other negative values. What gives?
The trick is that errno is a C concept. That’s why it’s documented as errno(3) — the 3 means it belongs to C. Just think about how messy this thing is: it’s a thread-local value living in the application’s address space. The kernel rightfully has nothing to do with it. Instead, the mmap(2) wrapper in libc assigns errno (if needed) after the system call returns. This is how all system calls through libc work, even with the syscall(2) wrapper.
So how does the kernel report the error? It’s an old-fashioned return value. If you have any doubts, take it straight from the horse’s mouth: mm/mmap.c:do_mmap(). Here’s a sample of return statements.
if (!len)
return -EINVAL;
/* Careful about overflows.. */
len = PAGE_ALIGN(len);
if (!len)
return -ENOMEM;
/* offset overflow? */
if ((pgoff + (len >> PAGE_SHIFT)) < pgoff)
return -EOVERFLOW;
/* Too many mappings? */
if (mm->map_count > sysctl_max_map_count)
return -ENOMEM;
It’s returning the negated error number. Simple enough.
If you think about it a moment, you might notice a complication: This is a form of in-band signaling. On success, mmap(2) returns a memory address. All those negative error numbers are potentially addresses that a caller might want to map. How can we tell the difference?
1) None of the possible error numbers align on a page boundary, so they’re not actually valid return values. NULL does lie on a page boundary, which is one reason why it’s not used as an error return value for mmap(2). The other is that you might actually want to map NULL, for better or worse.
2) Those low negative values lie in a region of virtual memory reserved exclusively for the kernel (sometimes called “low memory”). On x86-64, any address with the most significant bit set (i.e. the sign bit of a signed integer) is one of these addresses. Processes aren’t allowed to map these addresses, and so mmap(2) will never return such a value on success.
So what’s a clean, safe way to go about checking for error values? It’s a lot easier to read musl than glibc, so let’s take a peek at how musl does it in its own mmap: src/mman/mmap.c.
if (off & OFF_MASK) {
errno = EINVAL;
return MAP_FAILED;
}
if (len >= PTRDIFF_MAX) {
errno = ENOMEM;
return MAP_FAILED;
}
if (flags & MAP_FIXED) {
__vm_wait();
}
return (void *)syscall(SYS_mmap, start, len, prot, flags, fd, off);
Hmm, it looks like its returning the result directly. What happened to setting errno? Well, syscall() is actually a macro that runs the result through __syscall_ret().
#define syscall(...) __syscall_ret(__syscall(__VA_ARGS__))
Looking a little deeper: src/internal/syscall_ret.c.
long __syscall_ret(unsigned long r)
{
if (r > -4096UL) {
errno = -r;
return -1;
}
return r;
}
Bingo. As documented, if the value falls within that “high” (unsigned) range of negative values for any system call, it’s an error number.
Getting back to the original question, we could employ this same check in the assembly code. However, since this is a anonymous memory map with a kernel-selected address, there’s only one possible error: ENOMEM (12). This error happens if the maximum number of memory maps has been reached, or if there’s no contiguous region available for the 4MB stack. The check will only need to test the result against -12.
]]>const
on optimization. Variations of this question
have been asked many times over the past two decades. Personally, I
blame naming of const
.
Given this program:
void foo(const int *);
int
bar(void)
{
int x = 0;
int y = 0;
for (int i = 0; i < 10; i++) {
foo(&x);
y += x; // this load not optimized out
}
return y;
}
The function foo
takes a pointer to const, which is a promise from
the author of foo
that it won’t modify the value of x
. Given this
information, it would seem the compiler may assume x
is always zero,
and therefore y
is always zero.
However, inspecting the assembly output of several different compilers
shows that x
is loaded each time around the loop. Here’s gcc 4.9.2
at -O3, with annotations, for x86-64,
bar:
push rbp
push rbx
xor ebp, ebp ; y = 0
mov ebx, 0xa ; loop variable i
sub rsp, 0x18 ; allocate x
mov dword [rsp+0xc], 0 ; x = 0
.L0: lea rdi, [rsp+0xc] ; compute &x
call foo
add ebp, dword [rsp+0xc] ; y += x (not optmized?)
sub ebx, 1
jne .L0
add rsp, 0x18 ; deallocate x
mov eax, ebp ; return y
pop rbx
pop rbp
ret
The output of clang 3.5 (with -fno-unroll-loops) is the same, except
ebp and ebx are swapped, and the computation of &x
is hoisted out of
the loop, into r14
.
Are both compilers failing to take advantage of this useful
information? Wouldn’t it be undefined behavior for foo
to modify
x
? Surprisingly, the answer is no. In this situation, this would
be a perfectly legal definition of foo
.
void
foo(const int *readonly_x)
{
int *x = (int *)readonly_x; // cast away const
(*x)++;
}
The key thing to remember is that const
doesn’t mean
constant. Chalk it up as a misnomer. It’s not an
optimization tool. It’s there to inform programmers — not the compiler
— as a tool to catch a certain class of mistakes at compile time. I
like it in APIs because it communicates how a function will use
certain arguments, or how the caller is expected to handle returned
pointers. It’s usually not strong enough for the compiler to change
its behavior.
Despite what I just said, occasionally the compiler can take
advantage of const
for optimization. The C99 specification, in
§6.7.3¶5, has one sentence just for this:
If an attempt is made to modify an object defined with a const-qualified type through use of an lvalue with non-const-qualified type, the behavior is undefined.
The original x
wasn’t const-qualified, so this rule didn’t apply.
And there aren’t any rules against casting away const
to modify an
object that isn’t itself const
. This means the above (mis)behavior
of foo
isn’t undefined behavior for this call. Notice how the
undefined-ness of foo
depends on how it was called.
With one tiny tweak to bar
, I can make this rule apply, allowing the
optimizer do some work on it.
const int x = 0;
The compiler may now assume that foo
modifying x
is undefined
behavior, therefore it never happens. For better or worse, this is
a major part of how a C optimizer reasons about your programs. The
compiler is free to assume x
never changes, allowing it to optimize
out both the per-iteration load and y
.
bar:
push rbx
mov ebx, 0xa ; loop variable i
sub rsp, 0x10 ; allocate x
mov dword [rsp+0xc], 0 ; x = 0
.L0: lea rdi, [rsp+0xc] ; compute &x
call foo
sub ebx, 1
jne .L0
add rsp, 0x10 ; deallocate x
xor eax, eax ; return 0
pop rbx
ret
The load disappears, y
is gone, and the function always returns
zero.
Curiously, the specification almost allows the compiler to go
further. Consider what would happen if x
were allocated somewhere
off the stack in read-only memory. That transformation would look like
this:
static const int __x = 0;
int
bar(void)
{
for (int i = 0; i < 10; i++)
foo(&__x);
return 0;
}
We would see a few more instructions shaved off (-fPIC, small code model):
section .rodata
x: dd 0
section .text
bar:
push rbx
mov ebx, 0xa ; loop variable i
.L0: lea rdi, [rel x] ; compute &x
call foo
sub ebx, 1
jne .L0
xor eax, eax ; return 0
pop rbx
ret
Because the address of x
is taken and “leaked,” this last transform
is not permitted. If bar
is called recursively such that a second
address is taken for x
, that second pointer would compare equally
(==
) with the first pointer depsite being semantically distinct
objects, which is forbidden (§6.5.9¶6).
Even with this special const
rule, stick to using const
for
yourself and for your fellow human programmers. Let the optimizer
reason for itself about what is constant and what is not.
Travis Downs nicely summed up this article in the comments:
]]>In general,
const
declarations can’t help the optimizer, butconst
definitions can.
If you want to see it all up front, here’s the full source: hotpatch.c
Here’s the function that I’m going to change:
void
hello(void)
{
puts("hello");
}
It’s dead simple, but that’s just for demonstration purposes. This will work with any function of arbitrary complexity. The definition will be changed to this:
void
hello(void)
{
static int x;
printf("goodbye %d\n", x++);
}
I was only going change the string, but I figured I should make it a little more interesting.
Here’s how it’s going to work: I’m going to overwrite the beginning of the function with an unconditional jump that immediately moves control to the new definition of the function. It’s vital that the function prototype does not change, since that would be a far more complex problem.
But first there’s some preparation to be done. The target needs to be augmented with some GCC function attributes to prepare it for its redefinition. As is, there are three possible problems that need to be dealt with:
The solution is the ms_hook_prologue
function attribute. This tells
GCC to put a hotpatch prologue on the function: a big, fat, 8-byte NOP
that I can safely clobber. This idea originated in Microsoft’s Win32
API, hence the “ms” in the name.
The solution is the aligned
function attribute, ensuring the
hotpatch prologue is properly aligned.
As you might have guessed, this is primarily fixed with the noinline
function attribute. Since GCC may also clone the function and call
that instead, so it also needs the noclone
attribute.
Even further, if GCC determines there are no side effects, it may
cache the return value and only ever call the function once. To
convince GCC that there’s a side effect, I added an empty inline
assembly string (__asm("")
). Since puts()
has a side effect
(output), this isn’t truly necessary for this particular example, but
I’m being thorough.
What does the function look like now?
__attribute__ ((ms_hook_prologue))
__attribute__ ((aligned(8)))
__attribute__ ((noinline))
__attribute__ ((noclone))
void
hello(void)
{
__asm("");
puts("hello");
}
And what does the assembly look like?
$ objdump -Mintel -d hotpatch
0000000000400848 <hello>:
400848: 48 8d a4 24 00 00 00 lea rsp,[rsp+0x0]
40084f: 00
400850: bf d4 09 40 00 mov edi,0x4009d4
400855: e9 06 fe ff ff jmp 400660 <puts@plt>
It’s 8-byte aligned and it has the 8-byte NOP: that lea
instruction
does nothing. It copies rsp
into itself and changes no flags. Why
not 8 1-byte NOPs? I need to replace exactly one instruction with
exactly one other instruction. I can’t have another thread in between
those NOPs.
Next, let’s take a look at the function that will perform the hotpatch. I’ve written a generic patching function for this purpose. This part is entirely specific to x86.
void
hotpatch(void *target, void *replacement)
{
assert(((uintptr_t)target & 0x07) == 0); // 8-byte aligned?
void *page = (void *)((uintptr_t)target & ~0xfff);
mprotect(page, 4096, PROT_WRITE | PROT_EXEC);
uint32_t rel = (char *)replacement - (char *)target - 5;
union {
uint8_t bytes[8];
uint64_t value;
} instruction = { {0xe9, rel >> 0, rel >> 8, rel >> 16, rel >> 24} };
*(uint64_t *)target = instruction.value;
mprotect(page, 4096, PROT_EXEC);
}
It takes the address of the function to be patched and the address of the function to replace it. As mentioned, the target must be 8-byte aligned (enforced by the assert). It’s also important this function is only called by one thread at a time, even on different targets. If that was a concern, I’d wrap it in a mutex to create a critical section.
There are a number of things going on here, so let’s go through them one at a time:
The .text segment will not be writeable by default. This is for both
security and safety. Before I can hotpatch the function I need to make
the function writeable. To make the function writeable, I need to make
its page writable. To make its page writeable I need to call
mprotect()
. If there was another thread monkeying with the page
attributes of this page at the same time (another thread calling
hotpatch()
) I’d be in trouble.
It finds the page by rounding the target address down to the nearest
4096, the assumed page size (sorry hugepages). Warning: I’m being a
bad programmer and not checking the result of mprotect()
. If it
fails, the program will crash and burn. It will always fail systems
with W^X enforcement, which will likely become the standard in the
future. Under W^X (“write XOR execute”), memory can either
be writeable or executable, but never both at the same time.
What if the function straddles pages? Well, I’m only patching the first 8 bytes, which, thanks to alignment, will sit entirely inside the page I just found. It’s not an issue.
At the end of the function, I mprotect()
the page back to
non-writeable.
I’m assuming the replacement function is within 2GB of the original in virtual memory, so I’ll use a 32-bit relative jmp instruction. There’s no 64-bit relative jump, and I only have 8 bytes to work within anyway. Looking that up in the Intel manual, I see this:
Fortunately it’s a really simple instruction. It’s opcode 0xE9 and it’s followed immediately by the 32-bit displacement. The instruction is 5 bytes wide.
To compute the relative jump, I take the difference between the functions, minus 5. Why the 5? The jump address is computed from the position after the jump instruction and, as I said, it’s 5 bytes wide.
I put 0xE9 in a byte array, followed by the little endian displacement. The astute may notice that the displacement is signed (it can go “up” or “down”) and I used an unsigned integer. That’s because it will overflow nicely to the right value and make those shifts clean.
Finally, the instruction byte array I just computed is written over the hotpatch NOP as a single, atomic, 64-bit store.
*(uint64_t *)target = instruction.value;
Other threads will see either the NOP or the jump, nothing in between. There’s no synchronization, so other threads may continue to execute the NOP for a brief moment even through I’ve clobbered it, but that’s fine.
Here’s what my test program looks like:
void *
worker(void *arg)
{
(void)arg;
for (;;) {
hello();
usleep(100000);
}
return NULL;
}
int
main(void)
{
pthread_t thread;
pthread_create(&thread, NULL, worker, NULL);
getchar();
hotpatch(hello, new_hello);
pthread_join(thread, NULL);
return 0;
}
I fire off the other thread to keep it pinging at hello()
. In the
main thread, it waits until I hit enter to give the program input,
after which it calls hotpatch()
and changes the function called by
the “worker” thread. I’ve now changed the behavior of the worker
thread without its knowledge. In a more practical situation, this
could be used to update parts of a running program without restarting
or even synchronizing.
These related articles have been shared with me since publishing this article:
]]>The Native API is a low-level API, a foundation for the implementation of the Windows API and various components that don’t use the Windows API (drivers, etc.). It includes a runtime library (RTL) suitable for replacing important parts of the C standard library, unavailable to freestanding programs. Very useful for a minimal program.
Unfortunately, using the Native API is a bit of a minefield. Not all of the documented Native API functions are actually exported by ntdll.dll, making them inaccessible both for linking and GetProcAddress(). Some are exported, but not documented as such. Others are documented as exported but are not documented when (which release of Windows). If a particular function wasn’t exported until Windows 8, I don’t want to use when supporting Windows 7.
This is further complicated by the Microsoft Windows SDK, where many
of these functions are just macros that alias C runtime functions.
Naturally, MinGW closely follows suit. For example, in both cases,
here is how the Native API function RtlCopyMemory
is “declared.”
#define RtlCopyMemory(dest,src,n) memcpy((dest),(src),(n))
This is certainly not useful for freestanding programs, though it has
a significant benefit for hosted programs: The C compiler knows the
semantics of memcpy()
and can properly optimize around it. Any C
compiler worth its salt will replace a small or aligned, fixed-sized
memcpy()
or memmove()
with the equivalent inlined code. For
example:
char buffer0[16];
char buffer1[16];
// ...
memcpy(buffer0, buffer1, 16);
// ...
On x86_64 (GCC 4.9.3, -Os), this memmove()
call is replaced with
two instructions. This isn’t possible when calling an opaque function
in a non-standard dynamic library. The side effects could be anything.
movaps xmm0, [rsp + 48]
movaps [rsp + 32], xmm0
These Native API macro aliases are what have allowed certain Wine issues to slip by unnoticed for years. Very few user space applications actually call Native API functions, even when addressed directly by name in the source. The development suite is pulling a bait and switch.
Like last time I danced at the edge of the compiler, this has
caused headaches in my recent experimentation with freestanding
executables. The MinGW headers assume that the programs including them
will link against a C runtime. Dirty hack warning: To work around it,
I have to undo the definition in the MinGW headers and make my own.
For example, to use the real RtlMoveMemory()
:
#include <windows.h>
#undef RtlMoveMemory
__declspec(dllimport)
void RtlMoveMemory(void *, const void *, size_t);
Anywhere where I might have previously used memmove()
I can instead
use RtlMoveMemory()
. Or I could trivially supply my own wrapper:
void *
memmove(void *d, const void *s, size_t n)
{
RtlMoveMemory(d, s, n);
return d;
}
As of this writing, the same approach is not reliable with
RtlCopyMemory()
, the cousin to memcpy()
. As far as I can tell, it
was only exported starting in Windows 7 SP1 and Wine 1.7.46 (June
2015). Use RtlMoveMemory()
instead. The overlap-handling overhead is
negligible compared to the function call overhead anyway.
As a side note: one reason besides minimalism for not implementing
your own memmove()
is that it can’t be implemented efficiently in a
conforming C program. According to the language specification, your
implementation of memmove()
would not be permitted to compare its
pointer arguments with <
, >
, <=
, or >=
. That would lead to
undefined behavior when pointing to unrelated objects (ISO/IEC
9899:2011 §6.5.8¶5). The simplest legal approach is to allocate a
temporary buffer, copy the source buffer into it, then copy it into
the destination buffer. However, buffer allocation may fail — i.e.
NULL return from malloc()
— introducing a failure case to
memmove()
, which isn’t supposed to fail.
Update July 2016: Alex Elsayed pointed out a solution to the
memmove()
problem in the comments. In short: iterate over the
buffers bytewise (char *
) using equality (==
) tests to check for
an overlap. In theory, a compiler could optimize away the loop and
make it efficient.
I keep mentioning Wine because I’ve been careful to ensure my applications run correctly with it. So far it’s worked perfectly with both Windows API and Native API functions. Thanks to the hard work behind the Wine project, despite being written sharply against the Windows API, these tiny programs remain relatively portable (x86 and ARM). It’s a good fit for graphical applications (games), but I would never write a command line application like this. The command line has always been a second class citizen on Windows.
Mostly for my own future reference, here are export lists for two different versions of kernel32.dll and ntdll.dll:
As I collect more of these export lists, I’ll be able to paint a full
picture of when particular functions first appeared as exports. These
lists were generated with objdump -p <path_to_dll>
.
Now that I’ve got these Native API issues sorted out, I’ve
significantly expanded the capabilities of my tiny, freestanding
programs without adding anything to their size. Functions like
RtlUnicodeToUTF8N()
and RtlUTF8ToUnicodeN()
will surely be handy.
Recently I’ve been experimenting with freestanding C programs on
Windows. Freestanding refers to programs that don’t link, either
statically or dynamically, against a standard library (i.e. libc).
This is typical for operating systems and similar, bare metal
situations. Normally a C compiler can make assumptions about the
semantics of functions provided by the C standard library. For
example, the compiler will likely replace a call to a small,
fixed-size memmove()
with move instructions. Since a freestanding
program would supply its own, it may have different semantics.
My usual go to for C/C++ on Windows is Mingw-w64, which has greatly suited my needs the past couple of years. It’s packaged on Debian, and, when combined with Wine, allows me to fully develop Windows applications on Linux. Being GCC, it’s also great for cross-platform development since it’s essentially the same compiler as the other platforms. The primary difference is the interface to the operating system (POSIX vs. Win32).
However, it has one glaring flaw inherited from MinGW: it links against msvcrt.dll, an ancient version of the Microsoft C runtime library that currently ships with Windows. Besides being dated and quirky, it’s not an official part of Windows and never has been, despite its inclusion with every release since Windows 95. Mingw-w64 doesn’t have a C library of its own, instead patching over some of the flaws of msvcrt.dll and linking against it.
Since so much depends on msvcrt.dll despite its unofficial nature, it’s unlikely Microsoft will ever drop it from future releases of Windows. However, if strict correctness is a concern, we must ask Mingw-w64 not to link against it. An alternative would be PlibC, though the LGPL licensing is unfortunate. Another is Cygwin, which is a very complete POSIX environment, but is heavy and GPL-encumbered.
Sometimes I’d prefer to be more direct: skip the C standard library altogether and talk directly to the operating system. On Windows that’s the Win32 API. Ultimately I want a tiny, standalone .exe that only links against system DLLs.
The most important benefit of a standard library like libc is a portable, uniform interface to the host system. So long as the standard library suits its needs, the same program can run anywhere. Without it, the programs needs an implementation of each host-specific interface.
On Linux, operating system requests at the lowest level are made
directly via system calls. This requires a bit of assembly language
for each supported architecture (int 0x80
on x86, syscall
on
x86-64, swi
on ARM, etc.). The POSIX functions of the various Linux
libc implementations are built on top of this mechanism.
For example, here’s a function for a 1-argument system call on x86-64.
long
syscall1(long n, long arg)
{
long result;
__asm__ volatile (
"syscall"
: "=a"(result)
: "a"(n), "D"(arg)
);
return result;
}
Then exit()
is implemented on top. Note: A real libc would do
cleanup before exiting, like calling registered atexit()
functions.
#include <syscall.h> // defines SYS_exit
void
exit(int code)
{
syscall1(SYS_exit, code);
}
The situation is simpler on Windows. Its low level system calls are
undocumented and unstable, changing across even minor updates. The
formal, stable interface is through the exported functions in
kernel32.dll. In fact, kernel32.dll is essentially a standard library
on its own (making the term “freestanding” in this case dubious). It
includes functions usually found only in user-space, like string
manipulation, formatted output, font handling, and heap management
(similar to malloc()
). It’s not POSIX, but it has analogs to much of
the same functionality.
The standard entry for a C program is main()
. However, this is not
the application’s true entry. The entry is in the C library, which
does some initialization before calling your main()
. When main()
returns, it performs cleanup and exits. Without a C library, programs
don’t start at main()
.
On Linux the default entry is the symbol _start
. It’s prototype
would look like so:
void _start(void);
Returning from this function leads to a segmentation fault, so it’s up to your application to perform the exit system call rather than return.
On Windows, the entry depends on the type of application. The two
relevant subsystems today are the console and windows subsystems.
The former is for console applications (duh). These programs may still
create windows and such, but must always have a controlling console.
The latter is primarily for programs that don’t run in a console,
though they can still create an associated console if they like. In
Mingw-w64, give -mconsole
(default) or -mwindows
to the linker to
choose the subsystem.
The default entry for each is slightly different.
int WINAPI mainCRTStartup(void);
int WINAPI WinMainCRTStartup(void);
Unlike Linux’s _start
, Windows programs can safely return from these
functions, similar to main()
, hence the int
return. The WINAPI
macro means the function may have a special calling convention,
depending on the platform.
On any system, you can choose a different entry symbol or address
using the --entry
option to the GNU linker.
One problem I’ve run into is Mingw-w64 generating code that calls
__chkstk_ms()
from libgcc. I believe this is a long-standing bug,
since -ffreestanding
should prevent these sorts of helper functions
from being used. The workaround I’ve found is to disable the stack
probe and pre-commit the whole stack.
-mno-stack-arg-probe -Xlinker --stack=0x100000,0x100000
Alternatively you could link against libgcc (statically) with -lgcc
,
but, again, I’m going for a tiny executable.
Here’s an example of a Windows “Hello, World” that doesn’t use a C library.
#include <windows.h>
int WINAPI
mainCRTStartup(void)
{
char msg[] = "Hello, world!\n";
HANDLE stdout = GetStdHandle(STD_OUTPUT_HANDLE);
WriteFile(stdout, msg, sizeof(msg), (DWORD[]){0}, NULL);
return 0;
}
To build it:
x86_64-w64-mingw32-gcc -std=c99 -Wall -Wextra \
-nostdlib -ffreestanding -mconsole -Os \
-mno-stack-arg-probe -Xlinker --stack=0x100000,0x100000 \
-o example.exe example.c \
-lkernel32
Notice I manually linked against kernel32.dll. The stripped final result is only 4kB, mostly PE padding. There are techniques to trim this down even further, but for a substantial program it wouldn’t make a significant difference.
From here you could create a GUI by linking against user32.dll
and
gdi32.dll
(both also part of Win32) and calling the appropriate
functions. I already ported my OpenGL demo to a freestanding
.exe, dropping GLFW and directly using Win32 and WGL. It’s much less
portable, but the final .exe is only 4kB, down from the original 104kB
(static linking against GLFW).
I may go this route for the upcoming 7DRL 2016 in March.
]]>x86-lookup is also available from MELPA.
To use it, you’ll need Poppler’s pdftotext command line
program — used to build an index of the PDF — and a copy of the
complete Volume 2 of Intel’s instruction set manual. There’s only one
command to worry about: M-x x86-lookup
.
This package should be familiar to anyone who’s used javadoc-lookup, one of my older packages. It has a common underlying itch: the context switch to read API documentation while coding should have as little friction as possible, otherwise I’m discouraged from doing it. In an ideal world I wouldn’t ever need to check documentation because it’s already in my head. By visiting documentation frequently with ease, it’s going to become familiar that much faster and I’ll be reaching for it less and less, approaching the ideal.
I picked up x86 assembly [about a year ago][x86] and for the first few months I struggled to find a good online reference for the instruction set. There are little scraps here and there, but not much of substance. The big exception is Félix Cloutier’s reference, which is an amazingly well-done HTML conversion of Intel’s PDF manuals. Unfortunately I could never get it working locally to generate my own. There’s also the X86 Opcode and Instruction Reference, but it’s more for machines than humans.
Besides, I often work without an Internet connection, so offline documentation is absolutely essential. (You hear that Microsoft? Not only do I avoid coding against Win32 because it’s badly designed, but even more so because you don’t offer offline documentation anymore! The friction to API reference your documentation is enormous.)
I avoided the official x86 documentation for awhile, thinking it would be too opaque, at least until I became more accustomed to the instruction set. But really, it’s not bad! With a handle on the basics, I would encourage anyone to dive into either Intel’s or AMD’s manuals. The reason there’s not much online in HTML form is because these manuals are nearly everything you need.
I chose Intel’s manuals for x86-lookup because I’m more familiar with it, it’s more popular, it’s (slightly) easier to parse, it’s offered as a single PDF, and it’s more complete. The regular expression for finding instructions is tuned for Intel’s manual and it won’t work with AMD’s manuals.
For a couple months prior to writing x86-lookup, I had a couple of scratch functions to very roughly accomplish the same thing. The tipping point for formalizing it was that last month I wrote my own x86 assembler. A single mnemonic often has a dozen or more different opcodes depending on the instruction’s operands, and there are often several ways to encode the same operation. I was frequently looking up opcodes, and navigating the PDF quickly became a real chore. I only needed about 80 different opcodes, so I was just adding them to the assembler’s internal table manually as needed.
Say you want to look up the instruction RDRAND.
Initially Emacs has no idea what page this is on, so the first step is to build an index mapping mnemonics to pages. x86-lookup runs the pdftotext command line program on the PDF and loads the result into a temporary buffer.
The killer feature of pdftotext is that it emits FORM FEED (U+0012)
characters between pages. Think of these as page breaks. By counting
form feed characters, x86-lookup can track the page for any part of
the document. In fact, Emacs is already set up to do this with its
forward-page
and backward-page
commands. So to build the index,
x86-lookup steps forward page-by-page looking for mnemonics, keeping
note of the page. Since this process typically takes about 10 seconds,
the index is cached in a file (see x86-lookup-cache-directory
) for
future use. It only needs to happen once for a particular manual on a
particular computer.
The mnemonic listing is slightly incomplete, so x86-lookup expands certain mnemonics into the familiar set. For example, all the conditional jumps are listed under “Jcc,” but this is probably not what you’d expect to look up. I compared x86-lookup’s mnemonic listing against NASM/nasm-mode’s mnemonics to ensure everything was accounted for. Both packages benefited from this process.
Once the index is built, pdftotext is no longer needed. If you’re desperate and don’t have this program available, you can borrow the index file from another computer. But you’re on your own for figuring that out!
So to look up RDRAND, x86-lookup checks the index for the page number
and invokes a PDF reader on that page. This is where not all PDF
readers are created equal. There’s no convention for opening a PDF to
a particular page and each PDF reader differs. Some don’t even support
it. To deal with this, x86-lookup has a function specialized for
different PDF readers. Similar to browse-url-browser-function
,
x86-lookup has x86-lookup-browse-pdf-function
.
By default it tries to open the PDF for viewing within Emacs (did you know Emacs is a PDF viewer?), falling back to on options if the feature is unavailable. I welcome pull requests for any PDF readers not yet supported by x86-lookup. Perhaps this functionality deserves its own package.
That’s it! It’s a simple feature that has already saved me a lot of time. If you’re ever programming in x86 assembly, give x86-lookup a spin.
]]>This article has a followup.
Linux has an elegant and beautiful design when it comes to threads: threads are nothing more than processes that share a virtual address space and file descriptor table. Threads spawned by a process are additional child processes of the main “thread’s” parent process. They’re manipulated through the same process management system calls, eliminating the need for a separate set of thread-related system calls. It’s elegant in the same way file descriptors are elegant.
Normally on Unix-like systems, processes are created with fork(). The new process gets its own address space and file descriptor table that starts as a copy of the original. (Linux uses copy-on-write to do this part efficiently.) However, this is too high level for creating threads, so Linux has a separate clone() system call. It works just like fork() except that it accepts a number of flags to adjust its behavior, primarily to share parts of the parent’s execution context with the child.
It’s so simple that it takes less than 15 instructions to spawn a thread with its own stack, no libraries needed, and no need to call Pthreads! In this article I’ll demonstrate how to do this on x86-64. All of the code with be written in NASM syntax since, IMHO, it’s by far the best (see: nasm-mode).
I’ve put the complete demo here if you want to see it all at once:
I want you to be able to follow along even if you aren’t familiar with x86_64 assembly, so here’s a short primer of the relevant pieces. If you already know x86-64 assembly, feel free to skip to the next section.
x86-64 has 16 64-bit general purpose registers, primarily used to manipulate integers, including memory addresses. There are many more registers than this with more specific purposes, but we won’t need them for threading.
rsp
: stack pointerrbp
: “base” pointer (still used in debugging and profiling)rax
rbx
rcx
rdx
: general purpose (notice: a, b, c, d)rdi
rsi
: “destination” and “source”, now meaningless namesr8
r9
r10
r11
r12
r13
r14
r15
: added for x86-64The “r” prefix indicates that they’re 64-bit registers. It won’t be relevant in this article, but the same name prefixed with “e” indicates the lower 32-bits of these same registers, and no prefix indicates the lowest 16 bits. This is because x86 was originally a 16-bit architecture, extended to 32-bits, then to 64-bits. Historically each of of these registers had a specific, unique purpose, but on x86-64 they’re almost completely interchangeable.
There’s also a “rip” instruction pointer register that conceptually walks along the machine instructions as they’re being executed, but, unlike the other registers, it can only be manipulated indirectly. Remember that data and code live in the same address space, so rip is not much different than any other data pointer.
The rsp register points to the “top” of the call stack. The stack keeps track of who called the current function, in addition to local variables and other function state (a stack frame). I put “top” in quotes because the stack actually grows downward on x86 towards lower addresses, so the stack pointer points to the lowest address on the stack. This piece of information is critical when talking about threads, since we’ll be allocating our own stacks.
The stack is also sometimes used to pass arguments to another function. This happens much less frequently on x86-64, especially with the System V ABI used by Linux, where the first 6 arguments are passed via registers. The return value is passed back via rax. When calling another function function, integer/pointer arguments are passed in these registers in this order:
So, for example, to perform a function call like foo(1, 2, 3)
, store
1, 2 and 3 in rdi, rsi, and rdx, then call
the function. The mov
instruction stores the source (second) operand in its destination
(first) operand. The call
instruction pushes the current value of
rip onto the stack, then sets rip (jumps) to the address of the
target function. When the callee is ready to return, it uses the ret
instruction to pop the original rip value off the stack and back
into rip, returning control to the caller.
mov rdi, 1
mov rsi, 2
mov rdx, 3
call foo
Called functions must preserve the contents of these registers (the same value must be stored when the function returns):
When making a system call, the argument registers are slightly different. Notice rcx has been changed to r10.
Each system call has an integer identifying it. This number is
different on each platform, but, in Linux’s case, it will never
change. Instead of call
, rax is set to the number of the
desired system call and the syscall
instruction makes the request to
the OS kernel. Prior to x86-64, this was done with an old-fashioned
interrupt. Because interrupts are slow, a special,
statically-positioned “vsyscall” page (now deprecated as a security
hazard), later vDSO, is provided to allow certain system
calls to be made as function calls. We’ll only need the syscall
instruction in this article.
So, for example, the write() system call has this C prototype.
ssize_t write(int fd, const void *buf, size_t count);
On x86-64, the write() system call is at the top of the system call
table as call 1 (read() is 0). Standard output is file
descriptor 1 by default (standard input is 0). The following bit of
code will write 10 bytes of data from the memory address buffer
(a
symbol defined elsewhere in the assembly program) to standard output.
The number of bytes written, or -1 for error, will be returned in rax.
mov rdi, 1 ; fd
mov rsi, buffer
mov rdx, 10 ; 10 bytes
mov rax, 1 ; SYS_write
syscall
There’s one last thing you need to know: registers often hold a memory
address (i.e. a pointer), and you need a way to read the data behind
that address. In NASM syntax, wrap the register in brackets (e.g.
[rax]
), which, if you’re familiar with C, would be the same as
dereferencing the pointer.
These bracket expressions, called an effective address, may be
limited mathematical expressions to offset that base address
entirely within a single instruction. This expression can include
another register (index), a power-of-two scalar (bit shift), and
an immediate signed offset. For example, [rax + rdx*8 + 12]
. If
rax is a pointer to a struct, and rdx is an array index to an element
in array on that struct, only a single instruction is needed to read
that element. NASM is smart enough to allow the assembly programmer to
break this mold a little bit with more complex expressions, so long as
it can reduce it to the [base + index*2^exp + offset]
form.
The details of addressing aren’t important this for this article, so don’t worry too much about it if that didn’t make sense.
Threads share everything except for registers, a stack, and thread-local storage (TLS). The OS and underlying hardware will automatically ensure that registers are per-thread. Since it’s not essential, I won’t cover thread-local storage in this article. In practice, the stack is often used for thread-local data anyway. The leaves the stack, and before we can span a new thread, we need to allocate a stack, which is nothing more than a memory buffer.
The trivial way to do this would be to reserve some fixed .bss (zero-initialized) storage for threads in the executable itself, but I want to do it the Right Way and allocate the stack dynamically, just as Pthreads, or any other threading library, would. Otherwise the application would be limited to a compile-time fixed number of threads.
You can’t just read from and write to arbitrary addresses in virtual memory, you first have to ask the kernel to allocate pages. There are two system calls this on Linux to do this:
brk(): Extends (or shrinks) the heap of a running process, typically located somewhere shortly after the .bss segment. Many allocators will do this for small or initial allocations. This is a less optimal choice for thread stacks because the stacks will be very near other important data, near other stacks, and lack a guard page (by default). It would be somewhat easier for an attacker to exploit a buffer overflow. A guard page is a locked-down page just past the absolute end of the stack that will trigger a segmentation fault on a stack overflow, rather than allow a stack overflow to trash other memory undetected. A guard page could still be created manually with mprotect(). Also, there’s also no room for these stacks to grow.
mmap(): Use an anonymous mapping to allocate a contiguous set of pages at some randomized memory location. As we’ll see, you can even tell the kernel specifically that you’re going to use this memory as a stack. Also, this is simpler than using brk() anyway.
On x86-64, mmap() is system call 9. I’ll define a function to allocate a stack with this C prototype.
void *stack_create(void);
The mmap() system call takes 6 arguments, but when creating an anonymous memory map the last two arguments are ignored. For our purposes, it looks like this C prototype.
void *mmap(void *addr, size_t length, int prot, int flags);
For flags
, we’ll choose a private, anonymous mapping that, being a
stack, grows downward. Even with that last flag, the system call will
still return the bottom address of the mapping, which will be
important to remember later. It’s just a simple matter of setting the
arguments in the registers and making the system call.
%define SYS_mmap 9
%define STACK_SIZE (4096 * 1024) ; 4 MB
stack_create:
mov rdi, 0
mov rsi, STACK_SIZE
mov rdx, PROT_WRITE | PROT_READ
mov r10, MAP_ANONYMOUS | MAP_PRIVATE | MAP_GROWSDOWN
mov rax, SYS_mmap
syscall
ret
Now we can allocate new stacks (or stack-sized buffers) as needed.
Spawning a thread is so simple that it doesn’t even require a branch instruction! It’s a call to clone() with two arguments: clone flags and a pointer to the new thread’s stack. It’s important to note that, as in many cases, the glibc wrapper function has the arguments in a different order than the system call. With the set of flags we’re using, it takes two arguments.
long sys_clone(unsigned long flags, void *child_stack);
Our thread spawning function will have this C prototype. It takes a function as its argument and starts the thread running that function.
long thread_create(void (*)(void));
The function pointer argument is passed via rdi, per the ABI. Store
this for safekeeping on the stack (push
) in preparation for calling
stack_create(). When it returns, the address of the low end of stack
will be in rax.
thread_create:
push rdi
call stack_create
lea rsi, [rax + STACK_SIZE - 8]
pop qword [rsi]
mov rdi, CLONE_VM | CLONE_FS | CLONE_FILES | CLONE_SIGHAND | \
CLONE_PARENT | CLONE_THREAD | CLONE_IO
mov rax, SYS_clone
syscall
ret
The second argument to clone() is a pointer to the high address of
the stack (specifically, just above the stack). So we need to add
STACK_SIZE
to rax to get the high end. This is done with the lea
instruction: load effective address. Despite the brackets,
it doesn’t actually read memory at that address, but instead stores
the address in the destination register (rsi). I’ve moved it back by 8
bytes because I’m going to place the thread function pointer at the
“top” of the new stack in the next instruction. You’ll see why in a
moment.
Remember that the function pointer was pushed onto the stack for safekeeping. This is popped off the current stack and written to that reserved space on the new stack.
As you can see, it takes a lot of flags to create a thread with clone(). Most things aren’t shared with the callee by default, so lots of options need to be enabled. See the clone(2) man page for full details on these flags.
CLONE_THREAD
: Put the new process in the same thread group.CLONE_VM
: Runs in the same virtual memory space.CLONE_PARENT
: Share a parent with the callee.CLONE_SIGHAND
: Share signal handlers.CLONE_FS
, CLONE_FILES
, CLONE_IO
: Share filesystem information.A new thread will be created and the syscall will return in each of the two threads at the same instruction, exactly like fork(). All registers will be identical between the threads, except for rax, which will be 0 in the new thread, and rsp which has the same value as rsi in the new thread (the pointer to the new stack).
Now here’s the really cool part, and the reason branching isn’t
needed. There’s no reason to check rax to determine if we are the
original thread (in which case we return to the caller) or if we’re
the new thread (in which case we jump to the thread function).
Remember how we seeded the new stack with the thread function? When
the new thread returns (ret
), it will jump to the thread function
with a completely empty stack. The original thread, using the original
stack, will return to the caller.
The value returned by thread_create() is the process ID of the new
thread, which is essentially the thread object (e.g. Pthread’s
pthread_t
).
The thread function has to be careful not to return (ret
) since
there’s nowhere to return. It will fall off the stack and terminate
the program with a segmentation fault. Remember that threads are just
processes? It must use the exit() syscall to terminate. This won’t
terminate the other threads.
%define SYS_exit 60
exit:
mov rax, SYS_exit
syscall
Before exiting, it should free its stack with the munmap() system call, so that no resources are leaked by the terminated thread. The equivalent of pthread_join() by the main parent would be to use the wait4() system call on the thread process.
If you found this interesting, be sure to check out the full demo link
at the top of this article. Now with the ability to spawn threads,
it’s a great opportunity to explore and experiment with x86’s
synchronization primitives, such as the lock
instruction prefix,
xadd
, and compare-and-exchange (cmpxchg
). I’ll discuss
these in a future article.
Until recently I didn’t really have preferences about x86 assemblers (GAS, NASM, YASM, FASM, MASM, etc.) or syntax (Intel, AT&T). I stuck to the GNU Assembler (GAS) since it’s already there with all the other GNU development tools I know and love, and it’s required for inline assembly in GCC. However, nasm-mode now marks my commitment to NASM as my primary x86 assembler.
I need an assembler that can assemble 16-bit code (8086, 8088, 80186,
80286), because real mode is fun. Despite its .code16gcc
directive, GAS is not suitable for this purpose. It’s just enough to
get the CPU into protected mode — as needed when writing an operating
system with GCC — and that’s it. A different assembler is required
for serious 16-bit programming.
GAS syntax has problems. I’m not talking about the argument order (source first or destination first), since there’s no right answer to that one. The linked article covers a number of problems, with these being the big ones for me:
The use of %
sigils on all registers is tedious. I’m sure it’s
handy when generating code, where it becomes a register namespace,
but it’s annoying to write.
Integer constants are an easy source of bugs. Forget the $
and
suddenly you’re doing absolute memory access, which is a poor
default. NASM simplifies this by using brackets []
for all such
“dereferences.”
GAS cannot produce pure binaries — raw machine code without any headers or container (ELF, COFF, PE). Pure binaries are useful for developing shellcode, bootloaders, 16-bit COM programs, and just-in-time compilers.
Being a portable assembler, GAS is the jack of all instruction sets, master of none. If I’m going to write a lot of x86 assembly, I want a tool specialized for the job.
I also looked at YASM, a rewrite of NASM. It supports 16-bit assembly and mostly uses NASM syntax. In my research I found that NASM used to lag behind in features due to slower development, which is what spawned YASM. In recent years this seems to have flipped around, with YASM lagging behind. If you’re using YASM, nasm-mode should work pretty well for you, since it’s still very similar.
YASM optionally supports GAS syntax, but this reintroduces almost all
of GAS’s problems. Even YASM’s improvements (i.e. its ORG
directive)
become broken when switching to GAS syntax.
FASM is the “flat assembler,” an assembler written in assembly language. This means it’s only available on x86 platforms. While I don’t really plan on developing x86 assembly on a Raspberry Pi, I’d rather not limit my options! I already regard 16-bit DOS programming as a form of embedded programming, and this may very well extend to the rest of x86 someday.
Also, it hasn’t made its way into the various Linux distribution package repositories, including Debian, so it’s already at a disadvantage for me.
This is Microsoft’s assembler that comes with Visual Studio. Windows
only and not open source, this is in no way a serious consideration.
But since NASM’s syntax was originally derived from MASM, it’s worth
mentioning. NASM takes the good parts of MASM and fixes the
mistakes (such as the offset
operator). It’s different enough
that nasm-mode would not work well with MASM.
It’s not perfect, but it’s got an excellent manual, it’s a
solid program that does exactly what it says it will do, has a
powerful macro system, great 16-bit support, highly portable, easy to
build, and its semantics and syntax has been carefully considered. It
also comes with a simple, pure binary disassembler (ndisasm
). In
retrospect it seems like an obvious choice!
My one complaint would be that it’s that it’s too flexible about labels. The colon on labels is optional, which can lead to subtle bugs. NASM will warn about this under some conditions (orphan-labels). Combined with the preprocessor, the difference between a macro and a label is ambiguous, short of re-implementing the entire preprocessor in Emacs Lisp.
Emacs comes with an asm-mode
for editing assembly code for various
architectures. Unfortunately it’s another jack-of-all-trades that’s
not very good. More so, it doesn’t follow Emacs’ normal editing
conventions, having unusual automatic indentation and self-insertion
behaviors. It’s what prompted me to make nasm-mode.
To be fair, I don’t think it’s possible to write a major mode that covers many different instruction set architectures. Each architecture has its own quirks and oddities that essentially makes gives it a unique language. This is especially true with x86, which, from its 37 year tenure touched by so many different vendors, comes in a number of incompatible flavors. Each assembler/architecture pair needs its own major mode. I hope I just wrote NASM’s.
One area where I’m still stuck is that I can’t find an x86 style guide. It’s easy to find half a dozen style guides of varying authority for any programming language that’s more than 10 years old … except x86. There’s no obvious answer when it comes to automatic indentation. How are comments formatted and indented? How are instructions aligned? Should labels be on the same line as the instruction? Should labels require a colon? (I’ve decided this is “yes.”) What about long label names? How are function prototypes/signatures documented? (The mode could take advantage of such a standard, a la ElDoc.) It seems everyone uses their own style. This is another conundrum for a generic asm-mode.
There are a couple of other nasm-modes floating around with different levels of completeness. Mine should supersede these, and will be much easier to maintain into the future as NASM evolves.
]]>Monday’s /r/dailyprogrammer challenge was to write a program to
read a recurrence relation definition and, through interpretation,
iterate it to some number of terms. It’s given an initial term
(u(0)
) and a sequence of operations, f
, to apply to the previous
term (u(n + 1) = f(u(n))
) to compute the next term. Since it’s an
easy challenge, the operations are limited to addition, subtraction,
multiplication, and division, with one operand each.
For example, the relation u(n + 1) = (u(n) + 2) * 3 - 5
would be
input as +2 *3 -5
. If u(0) = 0
then,
u(1) = 1
u(2) = 4
u(3) = 13
u(4) = 40
u(5) = 121
Rather than write an interpreter to apply the sequence of operations, for my submission (mirror) I took the opportunity to write a simple x86-64 Just-In-Time (JIT) compiler. So rather than stepping through the operations one by one, my program converts the operations into native machine code and lets the hardware do the work directly. In this article I’ll go through how it works and how I did it.
Update: The follow-up challenge uses Reverse Polish notation to allow for more complicated expressions. I wrote another JIT compiler for my submission (mirror).
Modern operating systems have page-granularity protections for different parts of process memory: read, write, and execute. Code can only be executed from memory with the execute bit set on its page, memory can only be changed when its write bit is set, and some pages aren’t allowed to be read. In a running process, the pages holding program code and loaded libraries will have their write bit cleared and execute bit set. Most of the other pages will have their execute bit cleared and their write bit set.
The reason for this is twofold. First, it significantly increases the security of the system. If untrusted input was read into executable memory, an attacker could input machine code (shellcode) into the buffer, then exploit a flaw in the program to cause control flow to jump to and execute that code. If the attacker is only able to write code to non-executable memory, this attack becomes a lot harder. The attacker has to rely on code already loaded into executable pages (return-oriented programming).
Second, it catches program bugs sooner and reduces their impact, so
there’s less chance for a flawed program to accidentally corrupt user
data. Accessing memory in an invalid way will causes a segmentation
fault, usually leading to program termination. For example, NULL
points to a special page with read, write, and execute disabled.
Memory returned by malloc()
and friends will be writable and
readable, but non-executable. If the JIT compiler allocates memory
through malloc()
, fills it with machine instructions, and jumps to
it without doing any additional work, there will be a segmentation
fault. So some different memory allocation calls will be made instead,
with the details hidden behind an asmbuf
struct.
#define PAGE_SIZE 4096
struct asmbuf {
uint8_t code[PAGE_SIZE - sizeof(uint64_t)];
uint64_t count;
};
To keep things simple here, I’m just assuming the page size is 4kB. In
a real program, we’d use sysconf(_SC_PAGESIZE)
to discover the page
size at run time. On x86-64, pages may be 4kB, 2MB, or 1GB, but this
program will work correctly as-is regardless.
Instead of malloc()
, the compiler allocates memory as an anonymous
memory map (mmap()
). It’s anonymous because it’s not backed by a
file.
struct asmbuf *
asmbuf_create(void)
{
int prot = PROT_READ | PROT_WRITE;
int flags = MAP_ANONYMOUS | MAP_PRIVATE;
return mmap(NULL, PAGE_SIZE, prot, flags, -1, 0);
}
Windows doesn’t have POSIX mmap()
, so on that platform we use
VirtualAlloc()
instead. Here’s the equivalent in Win32.
struct asmbuf *
asmbuf_create(void)
{
DWORD type = MEM_RESERVE | MEM_COMMIT;
return VirtualAlloc(NULL, PAGE_SIZE, type, PAGE_READWRITE);
}
Anyone reading closely should notice that I haven’t actually requested that the memory be executable, which is, like, the whole point of all this! This was intentional. Some operating systems employ a security feature called W^X: “write xor execute.” That is, memory is either writable or executable, but never both at the same time. This makes the shellcode attack I described before even harder. For well-behaved JIT compilers it means memory protections need to be adjusted after code generation and before execution.
The POSIX mprotect()
function is used to change memory protections.
void
asmbuf_finalize(struct asmbuf *buf)
{
mprotect(buf, sizeof(*buf), PROT_READ | PROT_EXEC);
}
Or on Win32 (that last parameter is not allowed to be NULL
),
void
asmbuf_finalize(struct asmbuf *buf)
{
DWORD old;
VirtualProtect(buf, sizeof(*buf), PAGE_EXECUTE_READ, &old);
}
Finally, instead of free()
it gets unmapped.
void
asmbuf_free(struct asmbuf *buf)
{
munmap(buf, PAGE_SIZE);
}
And on Win32,
void
asmbuf_free(struct asmbuf *buf)
{
VirtualFree(buf, 0, MEM_RELEASE);
}
I won’t list the definitions here, but there are two “methods” for inserting instructions and immediate values into the buffer. This will be raw machine code, so the caller will be acting a bit like an assembler.
asmbuf_ins(struct asmbuf *, int size, uint64_t ins);
asmbuf_immediate(struct asmbuf *, int size, const void *value);
We’re only going to be concerned with three of x86-64’s many
registers: rdi
, rax
, and rdx
. These are 64-bit (r
) extensions
of the original 16-bit 8086 registers. The sequence of
operations will be compiled into a function that we’ll be able to call
from C like a normal function. Here’s what it’s prototype will look
like. It takes a signed 64-bit integer and returns a signed 64-bit
integer.
long recurrence(long);
The System V AMD64 ABI calling convention says that the first
integer/pointer function argument is passed in the rdi
register.
When our JIT compiled program gets control, that’s where its input
will be waiting. According to the ABI, the C program will be expecting
the result to be in rax
when control is returned. If our recurrence
relation is merely the identity function (it has no operations), the
only thing it will do is copy rdi
to rax
.
mov rax, rdi
There’s a catch, though. You might think all the mucky
platform-dependent stuff was encapsulated in asmbuf
. Not quite. As
usual, Windows is the oddball and has its own unique calling
convention. For our purposes here, the only difference is that the
first argument comes in rcx
rather than rdi
. Fortunately this only
affects the very first instruction and the rest of the assembly
remains the same.
The very last thing it will do, assuming the result is in rax
, is
return to the caller.
ret
So we know the assembly, but what do we pass to asmbuf_ins()
? This
is where we get our hands dirty.
If you want to do this the Right Way, you go download the x86-64 documentation, look up the instructions we’re using, and manually work out the bytes we need and how the operands fit into it. You know, like they used to do out of necessity back in the 60’s.
Fortunately there’s a much easier way. We’ll have an actual assembler
do it and just copy what it does. Put both of the instructions above
in a file peek.s
and hand it to nasm
. It will produce a raw binary
with the machine code, which we’ll disassemble with nidsasm
(the
NASM disassembler).
$ nasm peek.s
$ ndisasm -b64 peek
00000000 4889F8 mov rax,rdi
00000003 C3 ret
That’s straightforward. The first instruction is 3 bytes and the return is 1 byte.
asmbuf_ins(buf, 3, 0x4889f8); // mov rax, rdi
// ... generate code ...
asmbuf_ins(buf, 1, 0xc3); // ret
For each operation, we’ll set it up so the operand will already be
loaded into rdi
regardless of the operator, similar to how the
argument was passed in the first place. A smarter compiler would embed
the immediate in the operator’s instruction if it’s small (32-bits or
fewer), but I’m keeping it simple. To sneakily capture the “template”
for this instruction I’m going to use 0x0123456789abcdef
as the
operand.
mov rdi, 0x0123456789abcdef
Which disassembled with ndisasm
is,
00000000 48BFEFCDAB896745 mov rdi,0x123456789abcdef
-2301
Notice the operand listed little endian immediately after the instruction. That’s also easy!
long operand;
scanf("%ld", &operand);
asmbuf_ins(buf, 2, 0x48bf); // mov rdi, operand
asmbuf_immediate(buf, 8, &operand);
Apply the same discovery process individually for each operator you
want to support, accumulating the result in rax
for each.
switch (operator) {
case '+':
asmbuf_ins(buf, 3, 0x4801f8); // add rax, rdi
break;
case '-':
asmbuf_ins(buf, 3, 0x4829f8); // sub rax, rdi
break;
case '*':
asmbuf_ins(buf, 4, 0x480fafc7); // imul rax, rdi
break;
case '/':
asmbuf_ins(buf, 3, 0x4831d2); // xor rdx, rdx
asmbuf_ins(buf, 3, 0x48f7ff); // idiv rdi
break;
}
As an exercise, try adding support for modulus operator (%
), XOR
(^
), and bit shifts (<
, >
). With the addition of these
operators, you could define a decent PRNG as a recurrence relation. It
will also eliminate the closed form solution to this problem so
that we actually have a reason to do all this! Or, alternatively,
switch it all to floating point.
Once we’re all done generating code, finalize the buffer to make it
executable, cast it to a function pointer, and call it. (I cast it as
a void *
just to avoid repeating myself, since that will implicitly
cast to the correct function pointer prototype.)
asmbuf_finalize(buf);
long (*recurrence)(long) = (void *)buf->code;
// ...
x[n + 1] = recurrence(x[n]);
That’s pretty cool if you ask me! Now this was an extremely simplified situation. There’s no branching, no intermediate values, no function calls, and I didn’t even touch the stack (push, pop). The recurrence relation definition in this challenge is practically an assembly language itself, so after the initial setup it’s a 1:1 translation.
I’d like to build a JIT compiler more advanced than this in the future. I just need to find a suitable problem that’s more complicated than this one, warrants having a JIT compiler, but is still simple enough that I could, on some level, justify not using LLVM.
]]>