nullprogram.com/blog/2016/08/12/
The end of the month marks Elfeed’s third birthday. Surprising
to nobody, it’s also been three years of heavy, daily use by me. While
I’ve used Elfeed concurrently on a number of different machines over
this period, I’ve managed to keep an Elfeed database index
with a lineage going all the way back to the initial development
stages, before the announcement. It’s a large, organically-grown
database that serves as a daily performance stress test. Hopefully
this means I’m one of the first people to have trouble if an invisible
threshold is ever exceeded.
I’m also the sort of person who gets excited when I come across an
interesting dataset, and I have this gem sitting right in front of me.
So a couple of days ago I pushed a new Elfeed function,
elfeed-csv-export, which exports a database index into three CSV
files. These are intended to serve as three tables in a SQL database,
exposing the database to interesting relational queries and joins.
Entry content (HTML, etc.) has always been considered volatile, so
this is not exported. The export function isn’t interactive (yet?), so
if you want to generate your own you’ll need to (require
'elfeed-csv) and evaluate it yourself.
All the source code for performing the analysis below on your own
database can be found here:
The three exported tables are feeds, entries, and tags. Here are
the corresponding columns (optional CSV header) for each:
url, title, canonical-url, author
id, feed, title, link, date
entry, feed, tag
And here’s the SQLite schema I’m using for these tables:
CREATE TABLE feeds (
    url TEXT PRIMARY KEY,
    title TEXT,
    canonical_url TEXT,
    author TEXT
);

CREATE TABLE entries (
    id TEXT NOT NULL,
    feed TEXT NOT NULL REFERENCES feeds (url),
    title TEXT,
    link TEXT NOT NULL,
    date REAL NOT NULL,
    PRIMARY KEY (id, feed)
);

CREATE TABLE tags (
    entry TEXT NOT NULL,
    feed TEXT NOT NULL,
    tag TEXT NOT NULL,
    FOREIGN KEY (entry, feed) REFERENCES entries (id, feed)
);
Web authors are notoriously awful at picking actually-unique entry
IDs, even when using the smarter option, Atom. I still simply
don’t trust that entry IDs are unique, so, as usual, I’ve qualified
them by their source feed URL, hence the primary key on both columns
in entries.
At this point I wish I had collected a lot more information. If I were
to start fresh today, Elfeed’s database schema would not only fully
match Atom’s schema, but also exceed it with additional logging:
- When was each entry actually fetched?
- How did each entry change since the last fetch?
- When and for what reason did a feed fetch fail?
- When did an entry stop appearing in a feed?
- How long did fetching take?
- How long did parsing take?
- Which computer (hostname) performed the fetch?
- What interesting HTTP headers were included?
- Even if not kept for archival, how large was the content?
I may start tracking some of these. If I don’t, I’ll be kicking myself
three years from now when I look at this again.
A look at my index
So just how big is my index? It’s 25MB uncompressed, 2.5MB
compressed. I currently follow 117 feeds, but my index includes
43,821 entries from 309 feeds. These entries are marked with
53,360 tags from a set of 35 unique tags. Some of these datapoints
are the result of temporarily debugging Elfeed issues and don’t
represent content that I actually follow. I’m more careful these days
to test in a temporary database as to avoid contamination. Some are
duplicates due to feeds changing URLs over the years. Some are
artifacts from old bugs. This all represents a bit of noise, but
should be negligible. During my analysis I noticed some of these
anomalies and took a moment to clean up obviously bogus data (weird
dates, etc.), all by adjusting tags.
The first thing I wanted to know is the weekday frequency. A number of
times I’ve blown entire Sundays working on Elfeed, and, as if to
frustrate my testing, it’s not unusual for several hours to pass
between new entries on Sundays. Is this just my perception or are
Sundays really that slow?
Here’s my query. I’m using SQLite’s strftime to shift the
result into my local time zone, Eastern Time. This time zone is the
source, or close to the source, of a large amount of the content. This
also automatically accounts for daylight savings time, which can’t be
done with a simple divide and subtract.
SELECT tag,
       cast(strftime('%w', date, 'unixepoch', 'localtime') AS INT) AS day,
       count(id) AS count
FROM entries
JOIN tags ON tags.entry = entries.id AND tags.feed = entries.feed
GROUP BY tag, day;
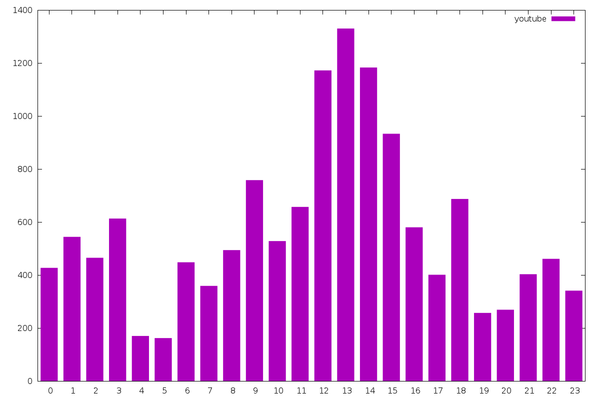
The most frequent tag (13,666 appearances) is “youtube”, which marks
every YouTube video, and I’ll use gnuplot to visualize it. The input
“file” is actually a command since gnuplot is poor at filtering data
itself, especially for histograms.
plot '< grep ^youtube, weekdays.csv' using 2:3 with boxes
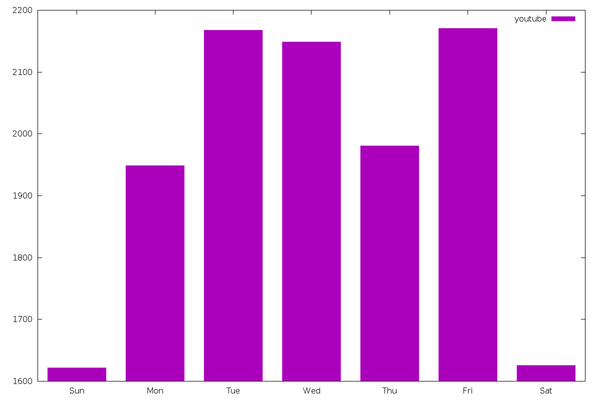
Wow, things do quiet down dramatically on weekends! From the
glass-half-full perspective, this gives me a chance to catch up when I
inevitably fall behind on these videos during the week.
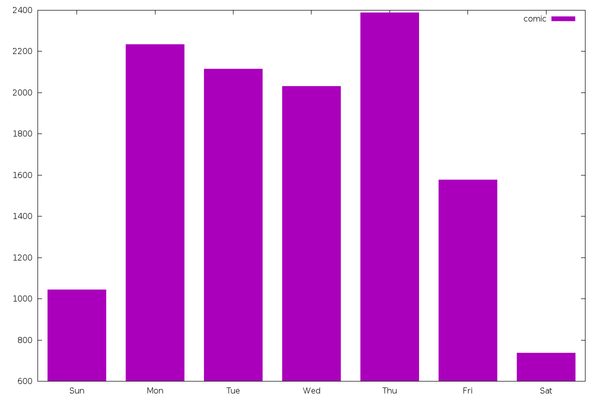
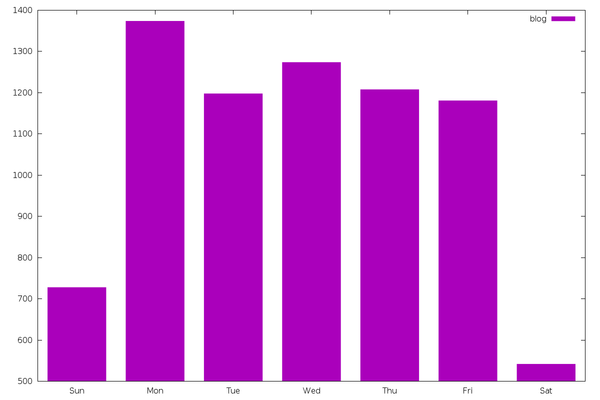
The same is basically true for other types of content, including
“comic” (12,465 entries) and “blog” (7,505 entries).
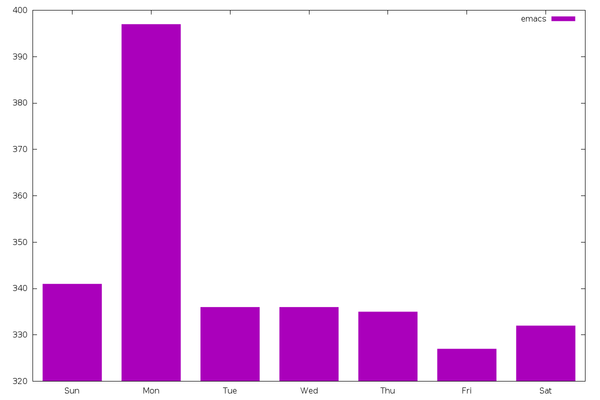
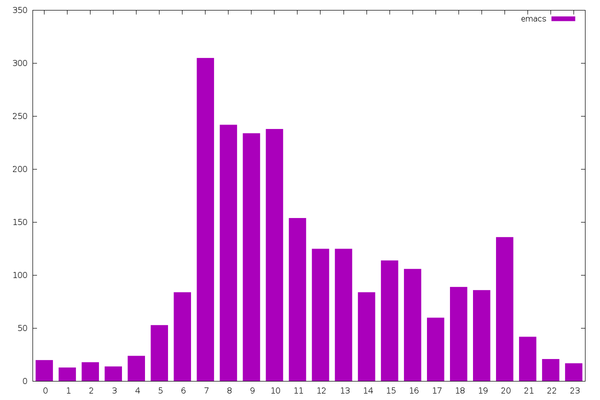
However, “emacs” (2,404 entries) is a different story. It doesn’t slow
down on the weekend, but Emacs users sure love to talk about Emacs on
Mondays. In my own index, this spike largely comes from Planet
Emacsen. Initially I thought maybe this was an artifact of
Planet Emacsen’s date handling — i.e. perhaps it does a big fetch on
Mondays and groups up the dates — but I double checked: they pass the
date directly through from the original articles.
Conclusion: Emacs users love Mondays. Or maybe they hate Mondays and
talk about Emacs as an escape.
I can reuse the same query to look at different time scales. When
during the day do entries appear? Adjusting the time zone here becomes
a lot more important.
SELECT tag,
       cast(strftime('%H', date, 'unixepoch', 'localtime') AS INT) AS hour,
       count(id) AS count
FROM entries
JOIN tags ON tags.entry = entries.id AND tags.feed = entries.feed
GROUP BY tag, hour;
Emacs bloggers tend to follow a nice Eastern Time sleeping schedule.
(I wonder how Vim bloggers compare, since, as an Emacs user, I
naturally assume Vim users’ schedules are as undisciplined as their
bathing habits.) However, this also might be prolific the
Irreal breaking the curve.
The YouTube channels I follow are a bit more erratic, but there’s
still a big drop in the early morning and a spike in the early
afternoon. It’s unclear if the timestamp published in the feed is the
upload time or the publication time. This would make a difference in
the result (e.g. overnight video uploads).
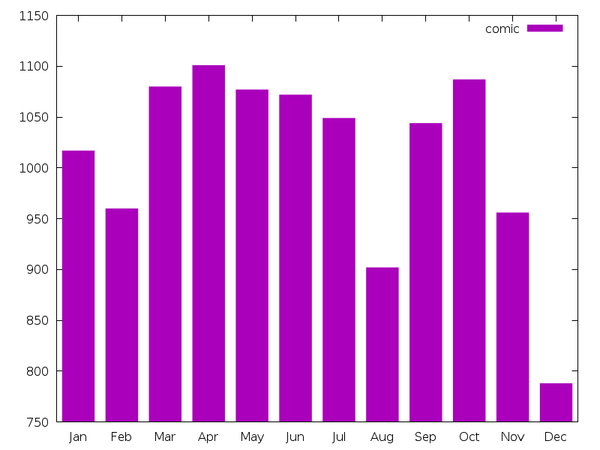
Do you suppose there’s a slow month?
SELECT tag,
       cast(strftime('%m', date, 'unixepoch', 'localtime') AS INT) AS day,
       count(id) AS count
FROM entries
JOIN tags ON tags.entry = entries.id AND tags.feed = entries.feed
GROUP BY tag, day;
December is a big drop across all tags, probably for the holidays.
Both “comic” and “blog” also have an interesting drop in August. For
brevity, I’ll only show one. This might be partially due my not
waiting until the end of this month for this analysis, since there are
only 2.5 Augusts in my 3-year dataset.
Unfortunately the timestamp is the only direct numerical quantity in
the data. So far I’ve been binning data points and counting to get a
second numerical quantity. Everything else is text, so I’ll need to
get more creative to find other interesting relationships.
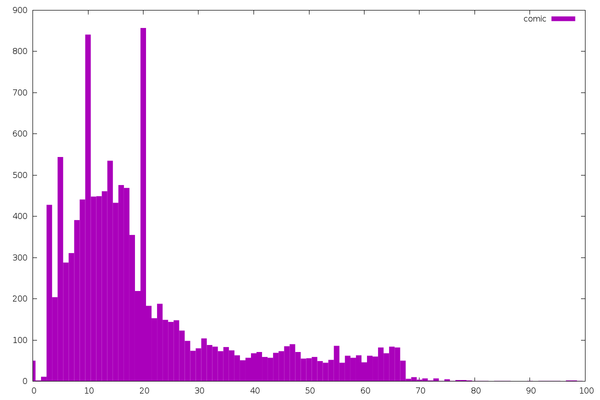
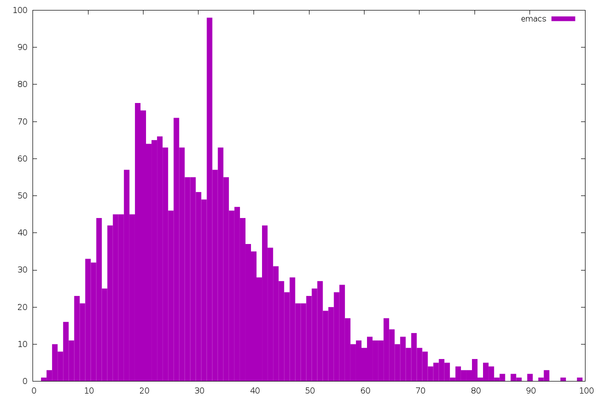
So let’s have a look a the lengths of entry titles.
SELECT tag,
       length(title) AS length,
       count(*) AS count
FROM entries
JOIN tags ON tags.entry = entries.id AND tags.feed = entries.feed
GROUP BY tag, length
ORDER BY length;
The shortest are the webcomics. I’ve complained about poor webcomic
titles before, so this isn’t surprising. The spikes are from
comics that follow a strict (uncreative) title format.
Emacs article titles follow a nice distribution. You can tell these
are programmers because so many titles are exactly 32 characters long.
Picking this number is such a natural instinct that we aren’t even
aware of it. Or maybe all their database schemas have VARCHAR(32)
title columns?
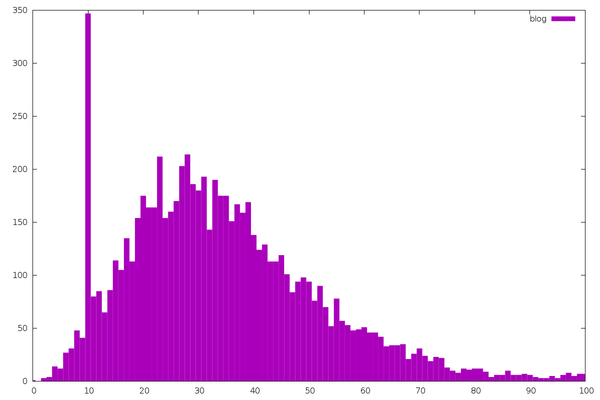
Blogs in general follow a nice distribution. The big spike is from the
Dwarf Fortress development blog, which follows a strict date
format.
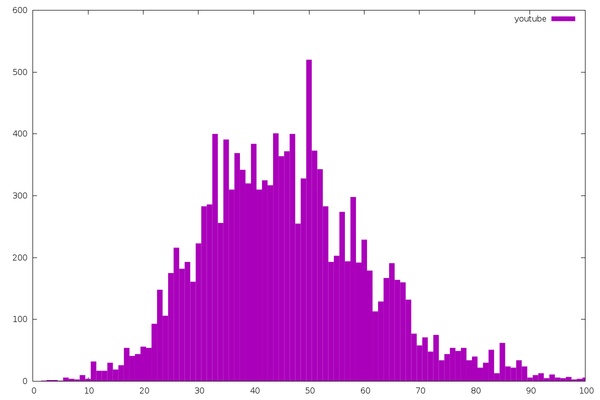
The longest on average are YouTube videos. This is largely due to the
kinds of videos I watch (“Let’s Play” videos), which tend to have
long, predictable names.
And finally, here’s the most interesting-looking graph of them all.
SELECT ((date - 4*60*60) % (24*60*60)) / (60*60) AS day_time,
       length(title) AS length
FROM entries
JOIN tags ON tags.entry = entries.id AND tags.feed = entries.feed;
This is the title length versus time of day (not binned). Each point
is one of the 53,360 posts.
set style fill transparent solid 0.25 noborder
set style circle radius 0.04
plot 'length-vs-daytime.csv' using 1:2 with circles
(This is a good one to follow through to the full size image.)
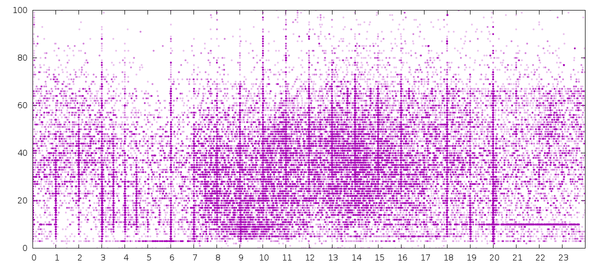
Again, all Eastern Time since I’m self-centered like that. Vertical
lines are authors rounding their post dates to the hour. Horizontal
lines are the length spikes from above, such as the line of entries at
title length 10 in the evening (Dwarf Fortress blog). There’s a the
mid-day cloud of entries of various title lengths, with the shortest
title cloud around mid-morning. That’s probably when many of the
webcomics come up.
Additional analysis could look further at textual content, beyond
simply length, in some quantitative way (n-grams? soundex?). But
mostly I really need to keep track of more data!