nullprogram.com/blog/2007/09/02/
(The author is currently open to employment opportunities in the United
States.)
In preparation for another project idea I have (to be posted in the
future), I wrote a Mandelbrot fractal generator in
Octave. Octave is great for just trying things out and
prototyping your algorithms. It is very slow, however. Here is the
code,
function mandel_img = mandel ()
  %% Parameters
  w = [-2.5 1.5]; % Domain
  h = [-1.5 1.5]; % Range
  s = 0.005;      % Step size
  it = 64;        % Iteration depth

  %% Prepare the complex plane
  [wa ha] = meshgrid (w(1):s:w(2), h(1):s:h(2));
  complex_plane = wa + ha * i;

  %% Preallocate image
  mandel_img = zeros( length(h(1):s:h(2)), length(w(1):s:w(2)));

  %% Generate mandelbrot
  for wi = 1:size(mandel_img, 2)
    for hi = 1:size(mandel_img, 1)

      z = 0;
      k = 0;
      while k < it && abs(z) < 2
        z = z^2 + complex_plane (hi, wi);
        k = k + 1;
      end
      mandel_img (hi, wi) = k - 1;

    end
    %% Display progress
    waitbar (wi/size(mandel_img, 2));
  end
end
You may need to comment out the waitbar line if you do not have
Octave-Forge installed properly (as is the case with Octave
2.9 on Debian as of this writing) or at all. You will also need
Octave-Forge if you want to use the image functions described
below. (This information is out of date.)
You can find the same code all over the Internet for many different
languages. The advantage with Octave is that it knows about complex
numbers so that this can be expressed directly with z = z^2 + c and
abs(z).
Now, this code just generates a matrix of the escape iteration numbers
for each pixel. To visualize this, you will need to use the image
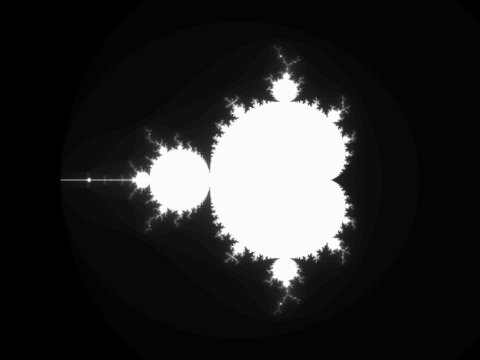
functions. The simplest thing to do is view the data as a boring
greyscale image.
octave> m = mandel(); # Generate the data
octave> imshow(m);
You should see something like this,

You can save this as an image with imwrite,
octave> imwrite("mandel.png", m*4)
The *4 part is because the iteration depth was set to 64. The image
being written will have values between 0 and 255. This allows the data
to use the full dynamic range of the image.
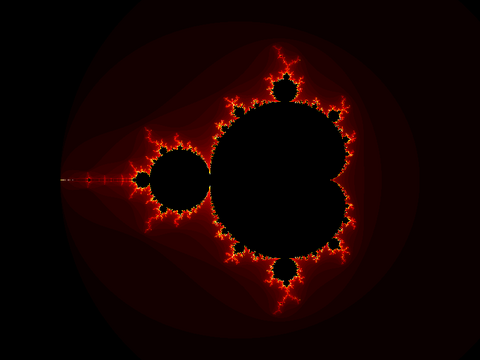
If you want more interesting images, you can apply a
colormap. Octave-Forge has two handy color maps, hot
and ocean (cool). To make the inside of the fractal
black, which are the points that are part of the set and never
escaped, stick black on the end of the colormap. This can be done like
this (viewing and saving),
octave> cmap = [hot(63); 0 0 0];  # The colormap
octave> imshow(m + 1, cmap);
octave> imwrite("mandel.png", m + 1, cmap);

m is between 0 and 63. We add one to it to put it between 1 and 64.
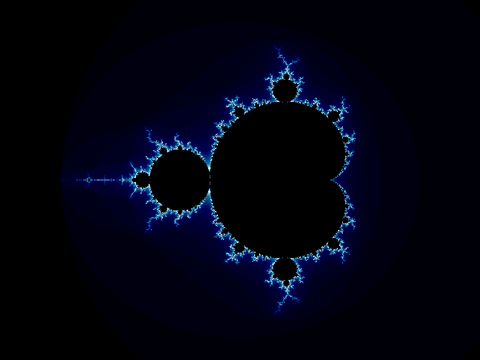
Then we take the colormap of length 63 and stick black on the end. If
you substitute ocean for hot, you will get a nice blue version.

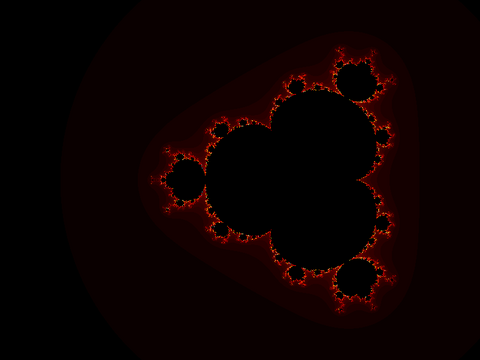
You can modify the code above to try to get different fractals. For
example, try z = z^4 + c instead,

More on fractals another time.