nullprogram.com/blog/2013/01/13/
This past week I came across this CSV-formatted data from Google. It’s
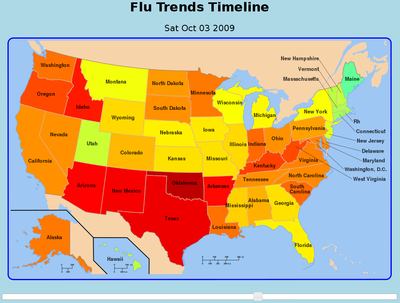
search engine trends for searches about the flu for different parts of
the US.
I thought it would be interesting to display this data on a map with a
slider along the bottom to select the date. Here’s the result of
spending two hours doing just that. I’m really happy with how it
turned out, and, further, I picked up a few new tricks from the
process.
You probably noticed there was a spinner when you first opened the
page. This is because it’s asynchronously fetching the latest
data.txt from Google. However, since it’s a
cross-origin request, and I don’t
control the server headers (static hosting), it’s using
AnyOrigin.com to translate it into a JSONP
request. That’s a really handy service!
To parse the CSV format, I’m using jquery-csv. I
wouldn’t mention it except that it has a really cool feature I haven’t
seen in any other CSV parser: instead of reading the text into a
two-dimensional array — which would need to be “parsed” further — it
can read in each row as a object, using the CSV header line as the
properties. This is the toObjects() function. It makes it feel like
reading straightforward JSON. For example,
name,color,weight
apple,red,1.2
banana,yellow,1.6
orange,orange,0.9
Will be parsed into this in JavaScript structure,
[{name:"apple",  color:"red",    weight:"1.2"},
 {name:"banana", color:"yellow", weight:"1.6"},
 {name:"orange", color:"orange", weight:"0.9"}]
With the flu data, it means each returned object is a single date
snapshot, just what I need. The only data-massaging I had to do was
mapping over each object to convert the date string into a proper Date
object.
Using two neat tricks I’ve got the latest data parsed into my desired
data structure. Next up is displaying a map. At first I wasn’t sure
how I to do this cleanly but then I remembered an old DailyProgrammer
problem: #89, Coloring the United States of America. SVG maps
tend to contain metadata describing what shape is what. In this case,
each state shape’s id attribute has the two-letter state code. Even
more, SVG plays very, very well with JavaScript. It can be manipulated
as part of the DOM, using the same API, including jQuery. It also uses
CSS for styling.
The tricky part is actually accessing the SVG’s document root. To do
this, it can’t be included as an img tag. Otherwise it’s an opaque
raster image as far as JavaScript is concerned. It either needs to be
embedded into the HTML — a dirty mix of languages that should be
avoided — or accessed through an asynchronous request. Accessing
remote XML was the original purpose of asynchronous browser requests,
after all (i.e. the poorly-named XMLHttpRequest object). I can host
this SVG from my own server, so this isn’t an issue like the CSV data.
HTML doesn’t have a slider input, unfortunately, so for the slider I’m
using the jQuery UI Slider. I’m not terribly impressed
with it but it gets the job done. Even before I had the slider
connected, I could change the display date on the fly from Emacs using
Skewer.
In regard my initial expectations, this project was surprisingly
very well suited for HTML and JavaScript. Being able to manipulate
SVG on the fly is really powerful and I doubt there’s an easier
platform on which to do it than the browser.